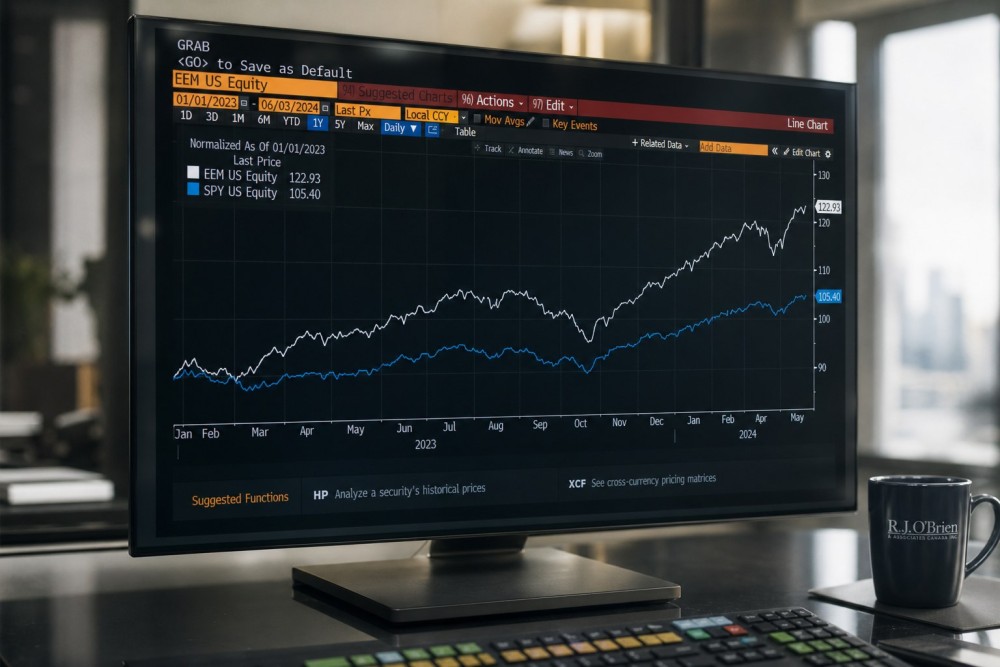
If you compare two stocks by glancing at their price charts, you are measuring price return, and the gap between total return vs price return is bigger than most investors realize. One number shows only how far a share price moved. The other adds the cash a company paid you along the way.
That cash matters. Dividends, reinvested over years, can quietly become the larger half of what an equity investor actually earns. Ignore them and you can badly misjudge which investment is winning.
This guide breaks down both measures, shows how dividends compound, and explains why total return is the only fair basis for comparing a high-dividend name against a low-yield growth stock.
Defining Price Return and Total Return
Price return captures one thing: capital appreciation. It is the percentage change in a stock's price between when you bought and when you sold, and nothing else. If a share rises from $100 to $115, the price return is 15%, full stop.
Total return is broader. According to Morningstar, total return measures the full gain on an investment by combining price change with income such as dividends, which is assumed to be reinvested. So that same $100 stock paying a 3% dividend delivers roughly an 18% total return, not 15%.
The distinction is not academic. Income-heavy names like Coca-Cola and Procter and Gamble earn a meaningful slice of their return from payouts, so judging them on price alone undersells them. If you are new to how those payouts work, our explainer on what is a dividend covers the basics.
How Dividends Compound Into Total Return
The reason total return outpaces price return so dramatically is compounding. When you reinvest a dividend, you buy more shares, those shares pay their own dividends, and the snowball grows on itself.
The long-run numbers are striking. According to Hartford Funds, going back to 1960, roughly 85% of the cumulative total return of the S&P 500 came from reinvested dividends and compounding. Over shorter windows dividends contribute closer to 30% of annual return, but stretched across decades the compounding effect dominates.
That is why a steady payer like Johnson and Johnson can look unremarkable on a price chart yet build serious wealth for a patient holder. The mechanics of turning payouts into shares matter, and our piece on dividend reinvestment walks through when it makes sense.
Trade US stocks from $1 with Gotrade and put compounding to work, reinvesting each dividend into more fractional shares instead of letting cash sit idle.
Why Index Charts Understate Returns
The S&P 500 figure quoted on the news and plotted on most charts is the price return index. It tracks price levels only and strips out every dividend the index components pay, which makes the headline chart a systematic understatement of what an investor earned. The chart misleads in two ways:
- It excludes the cash dividends paid out each quarter, so the line sits below your true wealth curve.
- It ignores reinvestment, so the second-order growth from dividends buying more shares never appears.
When you see "the S&P 500 returned X% since 1990," that is almost always price return. The total return version, what your account actually experienced, is meaningfully higher. Anyone serious about building income should read up on income investing with this distinction in mind.
Using Total Return to Compare Investments
Here is where it gets practical. Suppose you are choosing between a high-dividend consumer staple yielding 3% and a no-dividend growth stock. Compare them on price alone and the growth name almost always looks better, because all of its return sits in the price.
That comparison is rigged. The dividend payer's reinvested cash never enters a price chart, so you are weighing its incomplete return against the growth stock's complete one. Only total return puts them on equal footing. Two things to check before you compare:
- Confirm you are pulling the total return figure, not the raw price return, for both candidates.
- Use the same time horizon and assume dividends are reinvested across the full period.
Get this right and the high yielder often closes most or all of the gap. For a structured approach to picking such names, our overview of the best dividend investing strategy is a useful next step.
Conclusion
Price return answers a narrow question: how far did the price move? Total return answers the one that matters for your wealth, by folding in dividends and the compounding they unleash when reinvested. Decades of S&P 500 data show reinvested payouts can account for the large majority of long-run gains.
So before you judge any stock, especially a dividend payer, switch your lens from price return to total return. It is the only fair scoreboard, and it changes which investments look like winners.
Trade with fractional shares on Gotrade to build a dividend basket gradually, starting from $1 so you can reinvest every payout into more shares and let total return work in your favor.
FAQ
What is the difference between price return and total return?
Price return measures only the change in a stock's price, while total return adds reinvested dividends and other income.
Why do dividends matter so much over the long run?
Reinvested dividends buy more shares that pay their own dividends, compounding into a large share of total equity returns over decades.
Is the S&P 500 chart I see price return or total return?
The headline S&P 500 index quoted in most media is the price return version, which excludes dividends and understates real returns.
Should I use total return to compare a dividend stock with a growth stock?
Yes, because comparing them on price alone unfairly ignores the dividend payer's reinvested income.