The S&P 500 just posted an 11-session V-shaped recovery rally, climbing roughly 4.5% in the week ending April 18. If you hold US stocks, now is the time to check your portfolio and see which S&P 500 rally winners actually drove your returns.
Not every stock moved equally. Some surged double digits while others barely budged. Understanding which names carried your portfolio, and which ones lagged, is the difference between riding momentum and getting left behind.
NVIDIA led the charge
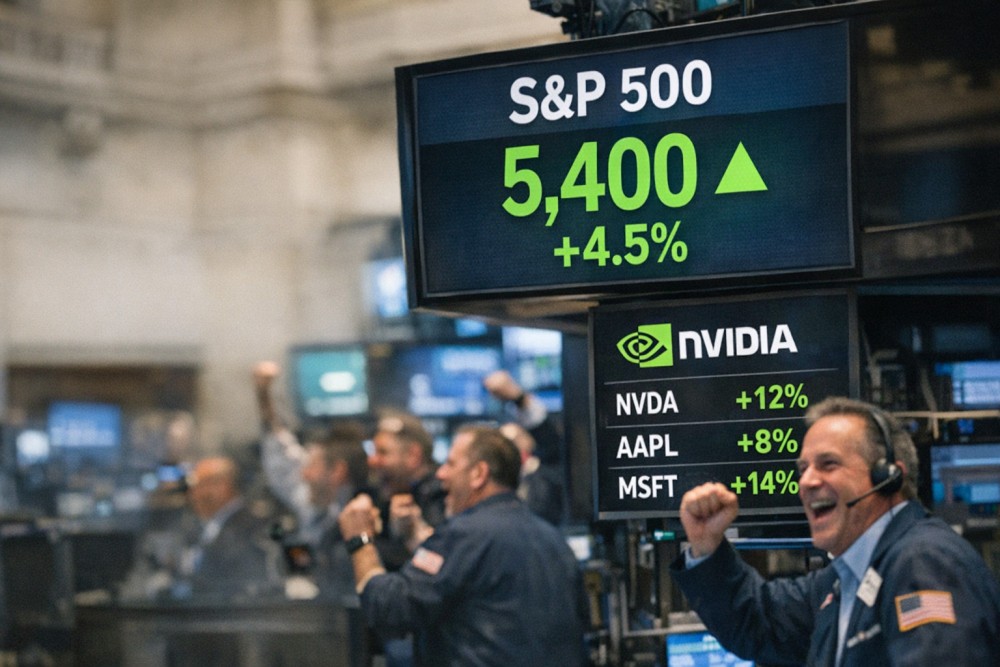
NVIDIA (NVDA) gained approximately 12% during the rally, making it the single largest contributor to S&P 500 gains. As the index's heaviest component at roughly 7% weighting, NVIDIA's move alone accounted for a significant chunk of the benchmark's advance.
The rally was sparked by tariff exemptions on electronics and easing US-China trade tensions. Semiconductor stocks were the biggest beneficiaries.
Big Tech followed closely
Microsoft (MSFT) surged 14%, outpacing even NVIDIA in percentage terms. Meta climbed 9%.
Apple and Amazon each added about 8%. If you hold any combination of these five names, your portfolio likely outperformed the broader index during this stretch.
According to CNBC, the Nasdaq composite gained roughly 7% over the same period, reflecting the tech-heavy nature of this recovery.
3 S&P 500 Stocks That Lagged the Rally
Not every corner of the market participated. Utilities, consumer staples, and healthcare stocks generally posted flat or single-digit gains while mega-cap tech ran.
If your portfolio is tilted toward defensive names, your returns likely trailed the index despite the headline numbers looking strong.
Potential entry points to watch
Laggards in a broad rally are not necessarily bad holdings. They may represent entry points if you believe the recovery has legs. Stocks that didn't move on tariff relief may catch up once earnings season confirms fundamentals remain intact.
The key question: are they lagging because of sector rotation, or because of company-specific weakness? Check your positions individually before adding.
Your Portfolio vs the Index: Are You Beating VOO This Month?
The simplest benchmark is SPY, the S&P 500 ETF. The index recovered from its April 8 low near 4,982 back above 5,400, a move of roughly 8.4% from trough to peak.
If your portfolio gained less than 4.5% over the past two weeks, you are underweight the stocks that drove this rally. That is not necessarily a problem if your allocation reflects your risk tolerance, but it is worth knowing.
According to Reuters, the VIX dropped below 20 for the first time since tariff-driven volatility began, signaling that the market expects calmer conditions ahead.
Already have a Gotrade account? Open your portfolio now and compare your two-week return against VOO. If you are trailing the index, this is a good moment to review your allocation.
Understanding whether you are beating or trailing the benchmark helps you make informed decisions about rebalancing. A portfolio of strong individual stocks can still underperform the index if the weightings are off.
How to Check and Rebalance Your Portfolio on Gotrade
Open your Gotrade app and navigate to your portfolio view. Each position shows your cost basis, current value, and percentage return. Sort by performance over the past month to see which stocks carried your gains.
Pay attention to concentration. If one stock now represents more than 20% of your portfolio after rallying hard, you may want to trim and redistribute.
Compare against the benchmark
Add SPY to your watchlist if it is not already there. Compare its recent performance against your overall portfolio return. This gives you a quick read on whether your stock selection is adding value or if you would have been better off in the index.
If you are new to ETFs and how they work, SPY tracks the full S&P 500 and serves as the most common performance benchmark for US equity portfolios.
Decide on next steps
If you outperformed, consider whether your winners are still fairly valued or if gains should be locked in. If you underperformed, look at whether adding exposure to the rally leaders makes sense at current prices.
Fractional shares on Gotrade let you invest in US stocks starting from just US$1, so rebalancing does not require large capital moves.
Conclusion
The 11-day S&P 500 rally rewarded portfolios heavy in mega-cap tech, with NVIDIA, Microsoft, Meta, Apple, and Amazon leading the charge. But headline index gains can mask what is actually happening in your individual holdings.
Now is the right time to open your Gotrade portfolio, review which positions drove your returns, and decide whether your allocation still matches your goals. Check your positions, compare against SPY, and rebalance where it makes sense.
FAQ
How much did the S&P 500 gain during the April 2026 rally?
The S&P 500 gained approximately 4.5% over 11 sessions, recovering from near 4,982 to above 5,400.
Which stocks gained the most during the rally?
Microsoft led with +14%, followed by NVIDIA at +12%, Meta at +9%, and Apple and Amazon each at +8%.
How do I check if my portfolio beat the S&P 500?
Compare your portfolio's two-week return against SPY's performance over the same period in your Gotrade app.