To read an earnings report, work through six components in order: the income statement, earnings per share, the balance sheet, the cash flow statement, guidance, and management commentary. An earnings report is a public company's periodic disclosure of revenue, expenses, and profit. US companies file three Form 10-Qs and one Form 10-K each year.
Understanding earnings reports is very crucial for retail investors, as they can provide deep insights into a company’s financial health and overall performance, but reading an earnings report for new retail investors can seem confusing and overwhelming; the reports consist of analyzing financial metrics for the next quarter or the rest of the year.
This guide will break down how to read an earnings report so you can understand the financial risks of a company you may invest in.
What Is an Earnings Report?
An earnings report is a company's financial statement that details the company’s revenues, expenses, and profits or losses within a period of time. The main components on the earnings report consist of the income statement, earnings per share, balance sheet, cash flow statement, guidance, and management commentary. US companies publish earnings reports to the SEC (Securities and Exchange Commission) four times a year.
This report is mandatorily written by the company and still one of the most useful documents for the retail investor because it’s the only required document for a business to show its performance. In the US, publicly listed companies are required to file a Form 10-Q for each of the first three fiscal quarters, with the fourth quarter folded into the annual Form 10-K.
Three filings carry most of what a US company tells the market, and beginners routinely confuse them.
Filing | What it covers | Frequency | Audited? |
Form 10-Q | Quarterly financial statements and management discussion | Three times a year, for Q1 to Q3 | No |
Form 10-K | Full fiscal year results, risk factors, and business description | Once a year | Yes |
Form 8-K | Material events between scheduled reports, including the earnings press release itself | As events occur | No |
How Does Reading an Earnings Report Work?
Investors get the report in two forms. Typically, a press release often contains just a preview of the company’s performance and a few paragraphs of information, and the other one is a full form which goes to the regulator consisting of a much longer and more detailed report.
Reading an earnings report usually works best as a fixed order, because the order protects you from the subjective headline.
The quarter ends. This is one of the most confusing for new retail investors when reading an earnings report. Many companies use fiscal calendars that do not align with the standard annual calendar at all, resulting in a wide variety of schedules for earnings report releases.
The books get closed. This is where accountants spend time finalising revenue, costs, and profit. During this time, executives are prohibited from discussing business trends with the public or analysts to prevent insider trading.
Analysts put out estimates. Researchers at banks and brokerages publish their forecasts for revenue and earnings per share before the release. The average of all these predictions forms the consensus estimate, which is the number the company is effectively being graded against.
The report drops. : Released pre-market or after-hours, investors receive two things. First is the Press Release, which highlights the best metrics and includes heavily curated quotes from the CEO. The second is the SEC filing, which contains the raw, unedited data, risk factors, and footnotes.
Management gets on a call. Executives walk through the quarter, then take questions from analysts live. This is where the real reaction often happens. You can put a good number in a press release, but you cannot dodge a follow-up question about why margins slipped.
The stock price moves. Price discovery happens instantly in the "extended hours" market, long before the market opens. Because fewer shares are being traded during these hours, the price swings are violent. A stock might jump on the initial press releases, only to drop when management gives poor guidance on the live call.
What Are the Components of an Earnings Report?
The earnings report contains six key metrics, each answering a different question about the business. Relying on just one metric can give investors a misleading picture of the quarter's performance.
1. Income statement
The income statement is the part that tells you whether the business actually grew or whether the growth got more expensive along the way.
2. Earnings per share
Earnings per share (EPS) is how much money a shareholder would receive for each share they own if all profits were distributed. With this, you can compare between a company worth $30 billion and one worth $3 trillion. This metric also ends up in the headline press nine times out of ten.
3. Balance sheet
The balance sheet report containing the company's financial condition only on a certain date (the last day of the quarter) and includes assets, liabilities, and equity. of a company.
4. Cash flow statement
Cash flow statements follow the money that goes in and out through operating activities, investing activities, and financing activities. From the cash flow statement, we can determine how well the company generates cash and meets its obligations.
5. Guidance
Guidance represents management's expectations for the future. The company's management forecasts for expected revenue, profit margins, and EPS for either the following quarter or the rest of the year,
During this call, the company executives explain financial results, outline operational drivers, and discuss strategic priorities. You must verify all their narrative against the numbers in the financial statements
Why Does Reading an Earnings Report Matter?
Media Narratives
Understanding the earnings report yourself can broaden your perspective and avoid all the subjective headlines from the financial media. For instance, almost 86% of S&P 500 companies reported EPS above estimates for the second quarter of 2026, against a five-year average of 78% and a ten year average of 76% reported by FactSet's Earnings Insight. Three companies in four beat the consensus in a normal quarter. Beating earnings estimates is essentially a baseline expectation rather than definitive proof of exceptional performance.
Adjusted Earnings and Long-Term Trends
The other reason is you have to actually read the adjusted number rather than just accept it as it is. For example, Microsoft reported GAAP diluted EPS of $4.81 and non-GAAP EPS of $4.74 for the same quarter. The $0.07 difference came from marking its OpenAI investment to market, roughly $480 million that moved through reported earnings without any cash changing hands. Neither figure is wrong, and comparing one company's adjusted number against another's GAAP number produces nonsense.
Analyzing multiple reports each year will demonstrate whether a business is truly experiencing cumulative growth or merely stagnating without significant progress.
What Are the Risks and Things to Watch?
There are several things you need to check and analyze further before making an investment decision.
Prices move sharply and unpredictably. Microsoft and Meta both reported on 29 July 2026. Nvidia reported a month later, on 26 August 2026. Microsoft rose about 8% in extended trading, Meta fell close to 10%, and Nvidia gained roughly 9% the following session.
Unexpected one-off charges distort a single quarter. Meta's Q2 2026 report stated they record $2.40 billion legal charge and $1.18 billion of severance, these figures make the company appear to be a struggling business. Charges like these cut both ways, and their absence can easily make an otherwise weak quarterly performance appear better.
Guidance is a forecast, not a commitment. Companies can revise their guidance at any time and may act subjectively based on their own narrative; you need to conduct a detailed re-evaluation using the metrics found in the earnings report.
Currency risk applies to investors outside the United States. If you buy a U.S. stock, you are effectively buying U.S. Dollars. Your return depends on the exchange rate and the share price.
How to Read Earnings Reports on Gotrade
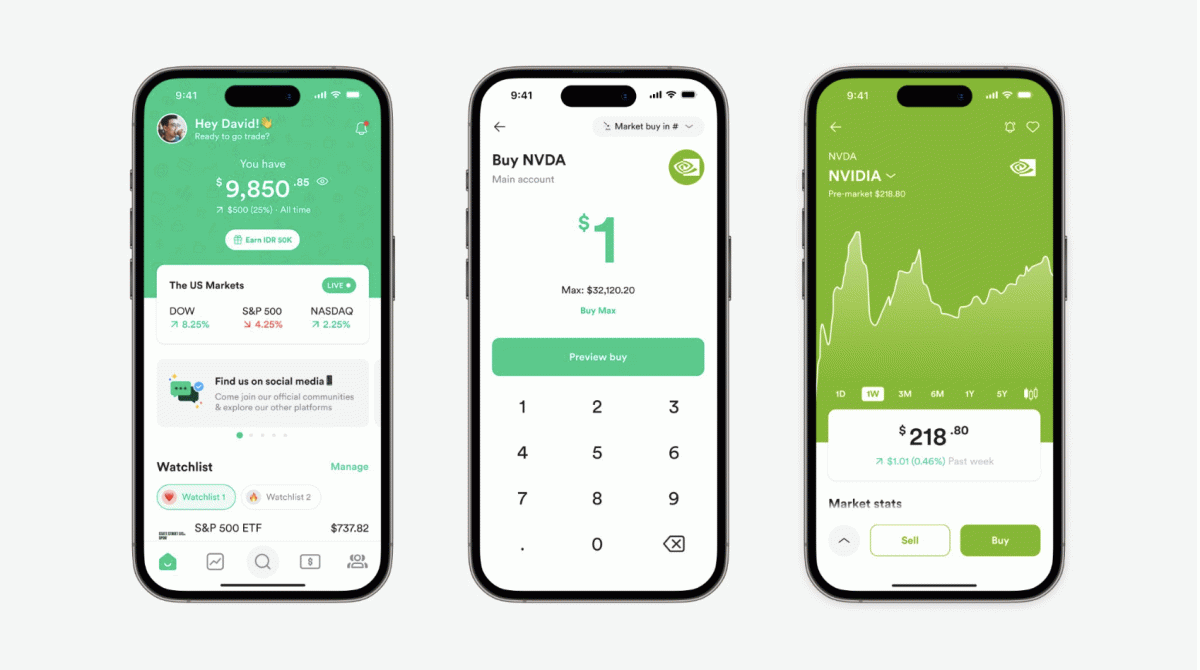
While Gotrade app does not currently provide detailed earnings reports; instead, it offers a "Market Statistics" section. You can access comprehensive details via EDGAR or the company's investor relations page.
You can also analyze earnings reports within the Market Statistics section of the Gotrade app. Simply navigate to a stock's page and tap on "Market Statistics." There, you will find various metrics such as market cap, price-to-sales, price-to-book, price-to-earnings (P/E), and others. Metrics like EPS and P/E are derived from the income statement, price-to-book comes from the balance sheet, and return on equity is calculated using data from both.
It is important to understand the difference between the official earnings reports and the data displayed in the Gotrade app, as the in-app data covers the four most recent reporting periods.
Conclusion
Understanding a company's earnings report requires a step-by-step approach. Start by checking the fiscal period, comparing revenue against expenses, analyzing the share count underlying the EPS (earnings per share) figure, and treat guidance as an estimate rather than a guaranteed promise. Review reports from at least two consecutive quarters before drawing conclusions, as a single report reflects only for a specific time, whereas two reports can reveal the trajectory of performance.
Trade with fractional shares to follow a company across several reporting cycles without committing a full share to any single quarter's result. Open a Gotrade account and start with the businesses you already understand.




