Written by Aries Yuangga
Summary
Exxon Mobil (NYSE: XOM) just spent a decade grinding through one of the ugliest commodity cycles in history… and survived as a cash-printing monster.
Now the setup flips:
- Integrated energy titan with $500B+ market cap and global footprint across upstream, refining, chemicals, and specialty products.
- Upstream = profit engine ~72% of net income from oil & gas production, anchored by:
- Permian Basin (1.7M boe/d; ~13% of basin output)
- Guyana (>700k boe/d and ramping)
- Growth drivers 2025–2027:
- Production rising toward 5.1–5.4M boe/d
- Golden Pass LNG coming online (big, stable EBITDA stream)
- Structural cost cuts + margin recovery in chemicals
- Ongoing share buybacks through 2026
- Downstream & specialty businesses give counter-cyclical stability when crude is weak.
- Risks: commodity price cycles, chemical oversupply, possible softening of refining margins, or slowdown of buybacks.
Thesis: You’re buying a top-tier global energy compounder at a reasonable multiple, just as the capex cycle, LNG growth, and buybacks line up for better shareholder returns.
Rating: BUY, accumulate on weakness, think in 3–5 year horizons.
Technical Analysis
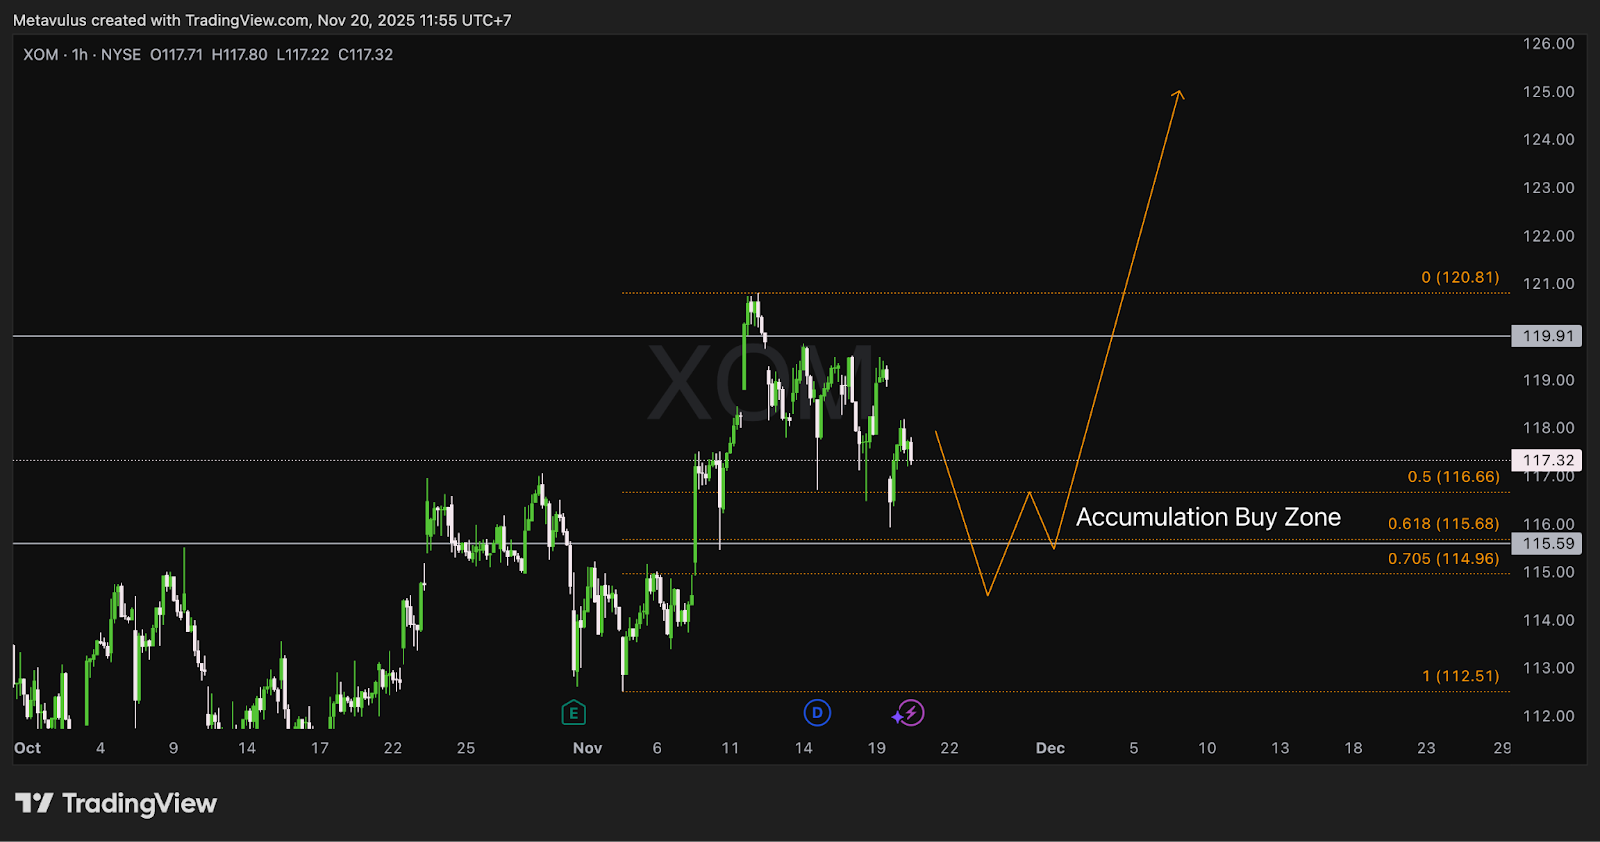
Current Price: ~US$117.32
Key Levels
Resistance
- US$119.91 → local range high / intraday supply
- US$120.81 → prior swing high / Fib 0 extension area
- Above that, room to US$124–126 as a stretch leg if energy sentiment turns risk-on.
Accumulation Buy Zone
From your chart + Fibs from the recent leg:
- Fib 0.5: US$116.66
- Fib 0.618: US$115.68
- Fib 0.705: US$114.96
- Horizontal support: US$115.59
👉 Preferred Accumulation Zone: US$116.7 – 115.0 (“sweet spot” where intraday structure + Fibs + prior demand overlap)
Deeper flush:
- US$112.51 → Fib 1.0 + prior reaction area (only for very patient DCA).
Invalidation
- 4H / Daily close < US$112 → breaks the current bullish structure; better to step aside and wait for a new base.
Read
Short-term, XOM is in a pullback / digestion after failing around 120–121.Structurally:
- Still trading in the upper half of the recent range.
- A drift down into 116–115 would be a healthy mean reversion inside a broader uptrend driven by cash-flow and buybacks.
- As long as price holds above ~115 / 112, the path of least resistance over the next few months remains back toward 120+, then 124–126 on any oil + energy-beta squeeze.
Trading Setup
DCA Plan (Long-Term Investor)
Objective: Build a 3–5 year position tied to FCF + dividends + buybacks.
- 40% size: US$117–116.5 (current area, first nibble)
- 35% size: US$116.5–115.0 (core accumulation zone)
- 25% size: US$115–112.5 (only if market panic / oil flush)
→ Full-fill average cost: ~US$115–116.
Risk Management
For Swing/Position Traders
- Cut / de-risk if:
- Daily close < US$115, or
- Daily close < US$112 for hard invalidation.
For Long-Term Investors
Use fundamental stops, not tight price stops.
Thesis breaks only if:
- Management stops capital discipline (over-spends, bad acquisitions).
- Buyback program materially slows or pauses for structural reasons.
- Long-term oil/gas/chem margins collapse and stay depressed for many years.
- Evidence that Permian/Guyana growth or Golden Pass economics are structurally weaker than expected.
Take Profit Levels
For traders / partial de-risking:
- TP1: US$120–121 → prior high; trim 15–25%.
- TP2: US$124–126 → next extension / potential exhaustion zone; trim another 20–30%.
- Stretch Target (cycle): US$130+ if oil + margins + buyback momentum all align.
Options / Income Ideas (Optional)
- Sell cash-secured puts:
- Strikes US$115 / 112.5 (30–45 DTE) → get paid to buy the dip into your buy zone.
- If assigned:
- Sell covered calls at US$125–130 to monetize volatility while collecting the dividend.
Why The Thesis Works (Pillars)
1️⃣ Upstream Engine: Permian + Guyana = High-Quality Volume Growth
- ~72% of net income from upstream; 4.8M boe/d moving toward 5.1–5.4M boe/d.
- Permian Basin:
- 1.7M boe/d (~13% of basin output) - scale = cost advantage.
- Guyana:
- 700k boe/d and ramping: world-class, low-cost barrels.
- Mix shift last decade: more liquids, less gas → higher profitability.
This volume growth at attractive breakevens gives XOM leverage to any recovery or stability in oil prices.
2️⃣ LNG & Midstream: Golden Pass Adds Sticky, Infrastructure-Like Cash Flow
- Golden Pass LNG (30% XOM share) starting up late 2025 / early 2026.
- Full 3-train capacity: 2.37 Bcf/d nameplate.
- Using Cheniere-style economics, XOM’s share could generate high-hundreds of millions in annual EBITDA (ballpark).
LNG is a long-contract, toll-like business → diversifies XOM away from pure oil price beta, while still tied to global gas demand.
3️⃣ Downstream & Specialty: Counter-Cyclical Shock Absorbers
- Refining & marketing:
- 4.3M bbl/d capacity; NA footprint particularly strong.
- When oil is weak, refining margins can still be high → cushions earnings.
- Specialty products (lubricants, waxes, synthetics, elastomers):
- Smaller slice of income, but high-margin, less capital-intensive.
These segments stabilize cash flow in ugly commodity environments, a key reason XOM can keep funding capex, dividends, and buybacks.
4️⃣ Chemicals: Currently Depressed, But Cycles Eventually Turn
- Chemical profits have been hammered by global overbuild (especially China ethylene + derivatives).
- Closures are already happening in China, Korea, Japan, which is how every commodity down-cycle eventually resolves.
- When margins revert even to mid-cycle, chemical earnings add a meaningful incremental tailwind.
You’re effectively buying XOM with chemicals priced for pain. Any normalization is upside optionality.
5️⃣ Capital Discipline, Cash Flow, and Buybacks
2014–2024:
- ~US$398B in cash flow from operations.
- ~US$255B reinvested into the business.
- US$142B paid in dividends.
- US$60B+ in share repurchases + more buybacks through 2026.
- Net debt actually down over decade.
This is textbook capital recycling + shareholder return.
If they maintain similar discipline into 2027 with a better commodity tape, the equity math is simple: share count down + earnings up = higher EPS + better total return.
Valuation & Scenarios (High Level)
Assume:
- Forward P/E around 17x, dividend yield ~3.3%, buybacks ongoing.
- Analyst forecasts: net income US$29B → 36B by 2027.
Base Case (2–3 Years)
- Production grows as planned in Permian + Guyana.
- Golden Pass ramps normally.
- Chemicals recover to mid-cycle.
- Oil trades in a broad “comfortable” band.
→ EPS growth high-single to low-double digits → Dividends + buybacks add 3–5% per year. Implied total return: ~10–14%/yr, price range US$130+ in 2–3 years.
Bull Case
- Stronger-than-expected oil prices & margins.
- Chemical cycle rebounds hard.
- Management keeps buybacks aggressive through 2027.
- Market re-rates XOM toward 18–20x on peak-cycle earnings.
→ Total return mid-teens+ annualized, → Price potentially US$140–150 in a strong energy tape.
Bear Case
- Oil & gas remain glut-ish; chemicals stay oversupplied longer.
- Refining margins normalize lower.
- XOM slows buybacks to protect balance sheet or pursue a large acquisition.
- Multiple compresses to 13–14x on flat/declining earnings.
→ Price could revisit US$100–105 → But you’re still collecting a 3–4% yield while waiting for the next cycle.
Risks
- Commodity Price Risk: Prolonged low oil/gas/chemical prices can cap earnings and stall the bull case.
- Chemical Overbuild: If plant closures lag and Chinese capacity keeps growing, margins could stay depressed longer than expected.
- Refining Margin Normalization: Recovery of Russian refining or demand slowdown could squeeze downstream.
- Capital Allocation Shifts: Big M&A or paused buybacks would reduce per-share compounding.
- Transition / Policy Risk: ESG pressure, carbon taxes, or aggressive climate policies can affect long-term multiples and project economics.
None of these are unique to XOM, but they shape the slope and speed of your returns.
Conclusion
Exxon Mobil has already survived the “lost decade” for energy, without blowing up the balance sheet and while still returning massive cash to shareholders.
Now you get:
- Growing high-quality production (Permian, Guyana),
- A new LNG cash-flow pillar (Golden Pass),
- Depressed chemical earnings with mean-reversion upside,
- Steady refining & specialty buffers,
- And a management team that has shown capital discipline and a clear commitment to buybacks + dividends.
At current levels, you’re not paying tech-style multiples; you’re paying a fair price for a global energy compounder right as the cycle looks set to improve.
Verdict: BUY.
- Accumulate on dips into US$116–115,
- Respect risk below US$112,
- Aim for US$125–130+ over the next cycle, while getting paid a solid dividend to wait.
Disclaimer
Gotrade is the trading name of Gotrade Securities Inc., registered with and supervised by the Labuan Financial Services Authority (LFSA). This content is for educational purposes only and does not constitute financial advice. Always do your own research (DYOR) before investing.