
American Assets Trust Inc (AAT) Stock
Key stats
- Market cap
- $1.33B
- Price / Earnings ratio
- 62.4x
- EPS (TTM)
- $0.35
- Volume
- Loading
- 52-week high
- $25.97
- 52-week low
- $17.72
- Dividend yield
- 6.27%
- Dividend amount (latest)
- $0.34
Source: third-party data provider, as of November 10, 2026
Compare with AAT
Recent news

American Assets Trust Q3 Earnings Call Highlights
American Assets Trust Q3 Earnings Call Highlights
AAT
American Assets Trust (AAT) Reports Q3 Earnings: What Key Metrics Have to Say
American Assets Trust (AAT) Reports Q3 Earnings: What Key Metrics Have to Say
AAT
American Assets Trust (AAT) Q3 FFO and Revenues Beat Estimates
American Assets Trust (AAT) Q3 FFO and Revenues Beat Estimates
AAT
High-Yield REITs vs. 10-Year Treasuries: Which Is the Better Buy?
High-Yield REITs vs. 10-Year Treasuries: Which Is the Better Buy?
AATNews tone: automated (AI) classification of the article's content, not a price prediction.
Technical indicators
- RSI 14
- 51.20
- MACD 12/26/9
- 0.05
- EMA 9 of MACD
- -0.00
- MACD histogram
- 0.05
- SMA 50
- $21.62
- Price above SMA 50
- EMA 50
- $21.80
- Price below EMA 50
- SMA 200
- $21.54
- Price above SMA 200
- EMA 200
- $21.15
- Price above EMA 200
Calculated by Gotrade from daily closing prices, as of November 9, 2026. Technical data, not a recommendation.
Analyst ratings
No analyst data available
Financials
Performance
Debt & Balance Sheet
Revenue to Profit
2025Earnings
No data available
Source: third-party data provider
Latest news
American Assets Trust Q3 Earnings Call Highlights
American Assets Trust Q3 Earnings Call Highlights
AATAmerican Assets Trust (AAT) Reports Q3 Earnings: What Key Metrics Have to Say
American Assets Trust (AAT) Reports Q3 Earnings: What Key Metrics Have to Say
AATAmerican Assets Trust (AAT) Q3 FFO and Revenues Beat Estimates
American Assets Trust (AAT) Q3 FFO and Revenues Beat Estimates
AATHigh-Yield REITs vs. 10-Year Treasuries: Which Is the Better Buy?
High-Yield REITs vs. 10-Year Treasuries: Which Is the Better Buy?
AAT
American Assets Trust Executive Chairman Rady Buys Over $1 Million Shares. Does This Make AAT a Buy?
American Assets Trust Executive Chairman Rady Buys Over $1 Million Shares. Does This Make AAT a Buy?
AAT
American Assets Trust Founder Ernest Rady Buy $3.7 Million Shares in a Resoundingly Bullish Move
American Assets Trust Founder Ernest Rady Buy $3.7 Million Shares in a Resoundingly Bullish Move
AAT
American Assets Trust Executive Chairman Rady Buys 100,000 Shares. Is This a Bullish Signal?
American Assets Trust Executive Chairman Rady Buys 100,000 Shares. Is This a Bullish Signal?
AAT
American Assets Trust Executive Chairman Rady Buys $1.8 Million Shares. What Is This Telling Investors?
American Assets Trust Executive Chairman Rady Buys $1.8 Million Shares. What Is This Telling Investors?
AAT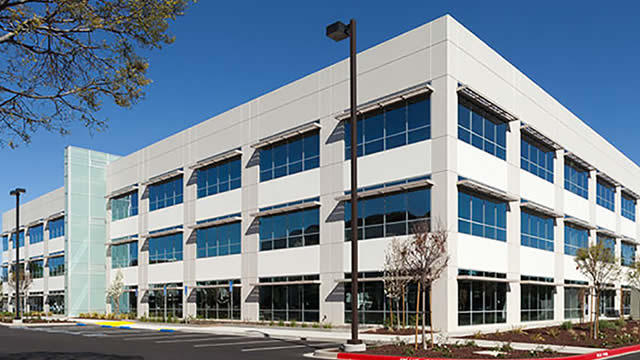
American Assets Trust Executive Chairman Rady Buys $1. Million Shares.
American Assets Trust Executive Chairman Rady Buys $1. Million Shares.
AAT
Down 10.2% in 4 Weeks, Here's Why You Should You Buy the Dip in American Assets Trust (AAT)
Down 10.2% in 4 Weeks, Here's Why You Should You Buy the Dip in American Assets Trust (AAT)
AATNews tone: automated (AI) classification of the article's content, not a price prediction.
About American Assets Trust Inc
American Assets Trust Inc is a self-administered real estate investment trust based in the United States. The company invests in, operates, and develops retail, office, residential, and mixed-use properties. Properties are predominantly located in South California, Northern California, Oregon, Washington, and Hawaii. American Assets operates through four segments based on property type: retail; office; mixed-use, which consists of retail and hotel components; and multifamily, which includes the company's apartment properties. The retail and office segments collectively contribute the majority of the total revenue.
Key Executives
| Name | Title | Year Born |
|---|---|---|
| Mr. Adam Wyll | CEO, President & Secretary | 1975 |
| Mr. Ernest Sylvan Rady | Executive Chairman of the Board | 1937 |
| Mr. Robert F. Barton | Executive VP, Treasurer & CFO | 1957 |
| Mr. Jerry Gammieri | Senior Vice President of Construction & Development | 1965 |
| Mr. Christopher E. Sullivan | Senior Vice President of Retail Properties | 1962 |
| Mr. Steve Center | Senior Vice President of Office Properties | — |
| Meleana Leaverton | Associate General Counsel | — |
Fundamentals
Valuation
Profitability
Trading
Dividend
Source: third-party data provider, as of November 10, 2026
Technical indicators
- RSI 14
- 51.20
- MACD 12/26/9
- 0.05
- EMA 9 of MACD
- -0.00
- MACD histogram
- 0.05
- SMA 50
- $21.62
- Price above SMA 50
- EMA 50
- $21.80
- Price below EMA 50
- SMA 200
- $21.54
- Price above SMA 200
- EMA 200
- $21.15
- Price above EMA 200
Calculated by Gotrade from daily closing prices, as of November 9, 2026. Technical data, not a recommendation.
Analyst views
No analyst data available
Seasonality
Monthly price change (%)| Jan | Feb | Mar | Apr | May | Jun | Jul | Aug | Sep | Oct | Nov | Dec | |
|---|---|---|---|---|---|---|---|---|---|---|---|---|
| 2021 | -12.3 | +10.9 | ||||||||||
| 2022 | -4.5 | +2.0 | +4.5 | -5.5 | -3.3 | -10.8 | +0.2 | -7.5 | -7.0 | +7.1 | +4.6 | -6.7 |
| 2023 | +7.4 | -12.9 | -25.9 | -0.5 | +6.0 | +2.0 | +14.3 | -3.6 | -9.7 | -6.8 | +12.1 | +6.7 |
| 2024 | -2.2 | -3.9 | +1.5 | +1.1 | +1.4 | +2.7 | +5.3 | |||||
| 2026 | +0.0 | +8.3 | -6.4 | +13.0 | +12.1 | +5.4 | -6.5 | -5.9 | -5.1 | +2.2 | -0.9 |










