Argan, Inc. (AGX) Stock
Key stats
- Market cap
- $4.52B
- Price / Earnings ratio
- 23.8x
- EPS (TTM)
- $12.87
- Volume
- Loading
- 52-week high
- $805.75
- 52-week low
- $252.88
- Dividend yield
- 0.68%
- Dividend amount (latest)
- $0.50
Source: third-party data provider, as of November 13, 2026
Compare with AGX
Recent news
Argan vs. Primoris: Which Power Infrastructure Stock Has More Upside?
Argan vs. Primoris: Which Power Infrastructure Stock Has More Upside?
AGX
5 Construction Stocks That May Surprise This Earnings Season
5 Construction Stocks That May Surprise This Earnings Season
AGX
Can Argan's ValCor Deal Put Teledata on a Faster Growth Path Ahead?
Can Argan's ValCor Deal Put Teledata on a Faster Growth Path Ahead?
AGX
J or AGX: Which Is the Better Value Stock Right Now?
J or AGX: Which Is the Better Value Stock Right Now?
AGXNews tone: automated (AI) classification of the article's content, not a price prediction.
Technical indicators
- RSI 14
- 45.35
- MACD 12/26/9
- -21.79
- EMA 9 of MACD
- -21.70
- MACD histogram
- -0.08
- SMA 50
- $366.03
- Price below SMA 50
- EMA 50
- $376.85
- Price below EMA 50
- SMA 200
- $518.38
- Price below SMA 200
- EMA 200
- $452.00
- Price below EMA 200
Calculated by Gotrade from daily closing prices, as of November 11, 2026. Technical data, not a recommendation.
Analyst ratings
Analyst consensus: Buy
Based on 3 analyst ratings
Third-party analyst opinion, not a recommendation from Gotrade.
Financials
Performance
Debt & Balance Sheet
Revenue to Profit
2025Earnings
No data available
Source: third-party data provider
Latest news
Argan vs. Primoris: Which Power Infrastructure Stock Has More Upside?
Argan vs. Primoris: Which Power Infrastructure Stock Has More Upside?
AGX5 Construction Stocks That May Surprise This Earnings Season
5 Construction Stocks That May Surprise This Earnings Season
AGXCan Argan's ValCor Deal Put Teledata on a Faster Growth Path Ahead?
Can Argan's ValCor Deal Put Teledata on a Faster Growth Path Ahead?
AGXJ or AGX: Which Is the Better Value Stock Right Now?
J or AGX: Which Is the Better Value Stock Right Now?
AGX
Why Argan (AGX) is a Top Growth Stock for the Long-Term
Why Argan (AGX) is a Top Growth Stock for the Long-Term
AGX
Argan Stock Surges 25% YTD: Is the Rally Still Worth Chasing?
Argan Stock Surges 25% YTD: Is the Rally Still Worth Chasing?
AGX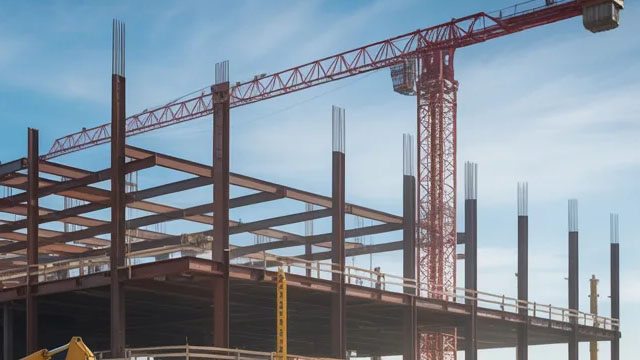
Can Argan Leverage Its Financial Strength to Support Business Growth?
Can Argan Leverage Its Financial Strength to Support Business Growth?
AGX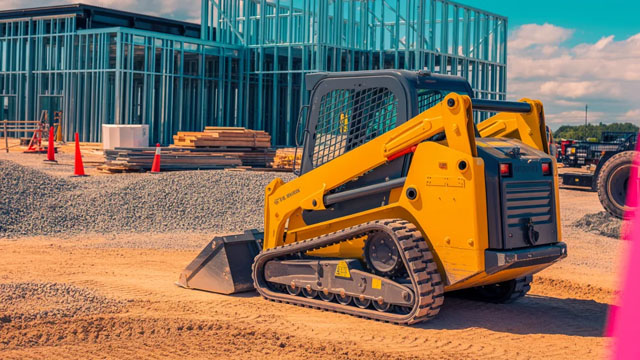
Implied Volatility Surging for Argan Stock Options
Implied Volatility Surging for Argan Stock Options
AGX
Here's Why Argan (AGX) is a Strong Momentum Stock
Here's Why Argan (AGX) is a Strong Momentum Stock
AGX
Argan (AGX) Down 7.8% Since Last Earnings Report: Can It Rebound?
Argan (AGX) Down 7.8% Since Last Earnings Report: Can It Rebound?
AGXNews tone: automated (AI) classification of the article's content, not a price prediction.
About Argan, Inc.
Argan Inc is a United States-based construction firm that conducts operations through its wholly-owned subsidiaries, GPS, APC, TRC, and SMC. Through GPS and APC it provides a full range of engineering, procurement, construction, commissioning, maintenance, project development and technical consulting services to the power generation market, including the renewable energy sector, for a wide range of customers, including independent power project owners, public utilities, power plant heavy equipment suppliers and other commercial firms with power requirements in the U.S., Ireland and the U.K. It operates in three segments: Power Services, Industrial Services, and Telecom Services, out of which Power Services derives the majority of revenue.
Key Executives
| Name | Title | Year Born |
|---|---|---|
| Mr. David Hibbert Watson CPA | CEO, President & Director | 1975 |
| Mr. Charles Edwin Collins IV | Chief Executive Officer of Gemma Power Systems, LLC | 1977 |
| Mr. Brian Orlandi | CEO of SMC Infrastructure Solutions (SMCiS) | — |
| Mr. Joshua S. Baugher | Senior VP, CFO & Treasurer | 1981 |
| Mr. Michael J. Hundley | Senior VP of Legal & Corporate Secretary | — |
Fundamentals
Valuation
Profitability
Trading
Dividend
Source: third-party data provider, as of November 13, 2026
Technical indicators
- RSI 14
- 45.35
- MACD 12/26/9
- -21.79
- EMA 9 of MACD
- -21.70
- MACD histogram
- -0.08
- SMA 50
- $366.03
- Price below SMA 50
- EMA 50
- $376.85
- Price below EMA 50
- SMA 200
- $518.38
- Price below SMA 200
- EMA 200
- $452.00
- Price below EMA 200
Calculated by Gotrade from daily closing prices, as of November 11, 2026. Technical data, not a recommendation.
Analyst views
3 analyst ratings
Third-party analyst opinion, not a recommendation from Gotrade.
- Low
- $273.00
- Average
- $552.67
- High
- $785.00
Seasonality
Monthly price change (%)| Jan | Feb | Mar | Apr | May | Jun | Jul | Aug | Sep | Oct | Nov | Dec | |
|---|---|---|---|---|---|---|---|---|---|---|---|---|
| 2021 | -12.3 | +0.0 | ||||||||||
| 2022 | -5.6 | +2.5 | +6.0 | -9.0 | +11.7 | -7.1 | -1.9 | -7.6 | -5.4 | +4.8 | +9.6 | -2.3 |
| 2023 | +6.2 | -0.2 | +3.2 | -1.8 | -0.4 | -1.0 | -5.0 | +11.2 | +6.7 | +0.4 | +0.6 | -0.4 |
| 2024 | -6.1 | +2.2 | +8.1 | +19.5 | +17.1 | +3.2 | +5.2 | |||||
| 2026 | +15.0 | +17.3 | -5.0 | +23.4 | -25.4 | -28.3 | -6.6 | -9.3 | -3.6 |
Corporate actions
Upcoming
No upcoming corporate actions for AGX