Alto Ingredients, Inc. Common Stock (ALTO) Stock
NASDAQ · ALTO
Key stats
- Market cap
- $297.88M
- Price / Earnings ratio
- 6.0x
- EPS (TTM)
- $0.66
- Volume
- Loading
- 52-week high
- $6.11
- 52-week low
- $1.50
Source: third-party data provider, as of November 13, 2026
Compare with ALTO
Recent news

Zacks Investment Research
Will Alto Ingredients' Higher Maintenance Costs Pressure Margins?
ALTOAugust 31, 2026
Zacks Investment Research
Will Alto Ingredients' Higher Maintenance Costs Pressure Margins?
ALTO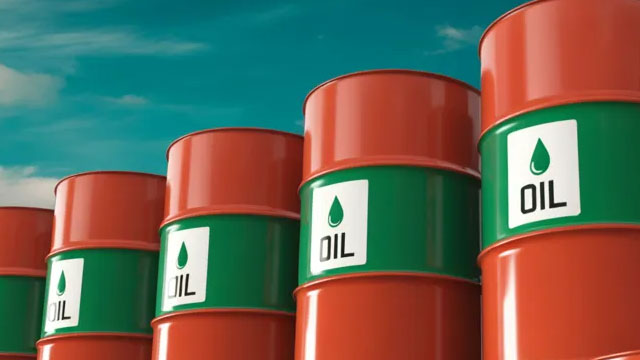
Zacks Investment Research
Alto Ingredients vs. Green Plains: Which Ethanol Stock Is Better?
ALTOAugust 26, 2026
Zacks Investment Research
Alto Ingredients vs. Green Plains: Which Ethanol Stock Is Better?
ALTO
Zacks Investment Research
Can Alto Ingredients Sustain Gains as Alcohol Premiums Narrow?
ALTOAugust 24, 2026
Zacks Investment Research
Can Alto Ingredients Sustain Gains as Alcohol Premiums Narrow?
ALTO
Zacks Investment Research
Can Alto Ingredients' Export Challenges Weigh on Growth Outlook?
ALTOAugust 17, 2026
Zacks Investment Research
Can Alto Ingredients' Export Challenges Weigh on Growth Outlook?
ALTOTechnical indicators
- RSI 14
- 58.55
- MACD 12/26/9
- 0.00
- EMA 9 of MACD
- -0.04
- MACD histogram
- 0.04
- SMA 50
- $3.76
- Price above SMA 50
- EMA 50
- $3.83
- Price above EMA 50
- SMA 200
- $4.32
- Price below SMA 200
- EMA 200
- $3.91
- Price below EMA 200
Calculated by Gotrade from daily closing prices, as of November 11, 2026. Technical data, not a recommendation.
Analyst ratings
Analyst consensus: Buy
Based on 1 analyst rating
Strong Sell0
Sell0
Hold0
Buy1
Strong Buy0
Third-party analyst opinion, not a recommendation from Gotrade.
Financials
Performance
Revenue
Net income
Net margin %
2021
2022
2023
2024
2025
2B1B529M0
Debt & Balance Sheet
Total assets
Total liabilities
2021
2022
2023
2024
2025
582M384M192M0
Revenue to Profit
2025$917.9M
Revenue$0.0
Cost of revenue$34.9M
Gross profit$0.0
Operating expenses$13.3M
Net incomeEarnings
No data available
Source: third-party data provider
Latest news
Zacks Investment Research
Will Alto Ingredients' Higher Maintenance Costs Pressure Margins?
ALTOAugust 31, 2026
Zacks Investment Research
Will Alto Ingredients' Higher Maintenance Costs Pressure Margins?
ALTOZacks Investment Research
Alto Ingredients vs. Green Plains: Which Ethanol Stock Is Better?
ALTOAugust 26, 2026
Zacks Investment Research
Alto Ingredients vs. Green Plains: Which Ethanol Stock Is Better?
ALTOZacks Investment Research
Can Alto Ingredients Sustain Gains as Alcohol Premiums Narrow?
ALTOAugust 24, 2026
Zacks Investment Research
Can Alto Ingredients Sustain Gains as Alcohol Premiums Narrow?
ALTOZacks Investment Research
Can Alto Ingredients' Export Challenges Weigh on Growth Outlook?
ALTOAugust 17, 2026
Zacks Investment Research
Can Alto Ingredients' Export Challenges Weigh on Growth Outlook?
ALTO
Zacks Investment Research
Should You Buy, Hold or Sell Alto Ingredients Stock Post Q2 Earnings?
ALTOAugust 14, 2026
Zacks Investment Research
Should You Buy, Hold or Sell Alto Ingredients Stock Post Q2 Earnings?
ALTO
Zacks Investment Research
Can 45Z Tax Credits Become Alto Ingredients' Next Earnings Driver?
ALTOAugust 11, 2026
Zacks Investment Research
Can 45Z Tax Credits Become Alto Ingredients' Next Earnings Driver?
ALTO
Zacks Investment Research
Why Does Alto Ingredients' Q2 EBITDA Surge Signal a Turnaround?
ALTOAugust 6, 2026
Zacks Investment Research
Why Does Alto Ingredients' Q2 EBITDA Surge Signal a Turnaround?
ALTO
Zacks Investment Research
ALTO Q2 Earnings Call Highlights Margin Recovery and 45Z Focus
ALTOAugust 6, 2026
Zacks Investment Research
ALTO Q2 Earnings Call Highlights Margin Recovery and 45Z Focus
ALTO
Zacks Investment Research
Alto Ingredients (ALTO) Q2 Earnings and Revenues Top Estimates
ALTOAugust 5, 2026
Zacks Investment Research
Alto Ingredients (ALTO) Q2 Earnings and Revenues Top Estimates
ALTO
MarketBeat
Alto Ingredients Q2 Earnings Call Highlights
ALTOAugust 5, 2026
MarketBeat
Alto Ingredients Q2 Earnings Call Highlights
ALTOAbout Alto Ingredients, Inc. Common Stock
No description available.
SectorBasic Materials
IndustrySpecialty Chemicals
Employees390
CEOMr. Bryon T. McGregor
IPO DateMar 24, 2005
HeadquartersPekin, IL
Key Executives
| Name | Title | Year Born |
|---|---|---|
| Mr. Bryon T. McGregor | CEO, President & Director | 1964 |
| Mr. Robert R. Olander | Chief Financial Officer | 1978 |
| Mr. Todd E. Benton | Chief Operating Officer | 1973 |
| Ms. Auste M. Graham J.D. | Chief Legal Officer & Secretary | 1980 |
| Mr. James R. Sneed CPA | Chief Commercial Officer | 1967 |
| Mr. Ed Baker | Vice President of Human Resources | — |
Fundamentals
Valuation
Price-to-sales ratio0.32
Price-to-book value1.09
PEG ratio0.80
Profitability
Return on Equity21.00%
Return on Assets13.00%
Return on Sales6.00%
Gross margin (latest quarter)5.74%
EBITDA$86.15M
Trading
Average volume1,049,012
Source: third-party data provider, as of November 13, 2026
Technical indicators
- RSI 14
- 58.55
- MACD 12/26/9
- 0.00
- EMA 9 of MACD
- -0.04
- MACD histogram
- 0.04
- SMA 50
- $3.76
- Price above SMA 50
- EMA 50
- $3.83
- Price above EMA 50
- SMA 200
- $4.32
- Price below SMA 200
- EMA 200
- $3.91
- Price below EMA 200
Calculated by Gotrade from daily closing prices, as of November 11, 2026. Technical data, not a recommendation.
Analyst views
1 analyst rating
Third-party analyst opinion, not a recommendation from Gotrade.
Analyst consensus:Buy
100% Buy
0% Hold
0% Sell
Analyst price target
- Low
- $7.00
- Average
- $7.00
- High
- $7.00
Seasonality
Monthly price change (%)| Jan | Feb | Mar | Apr | May | Jun | Jul | Aug | Sep | Oct | Nov | Dec | |
|---|---|---|---|---|---|---|---|---|---|---|---|---|
| 2021 | -4.1 | -3.2 | ||||||||||
| 2022 | +0.0 | +9.6 | +16.2 | -16.7 | -21.1 | -18.6 | +15.0 | +2.6 | -10.8 | +7.3 | -16.1 | -15.3 |
| 2023 | +16.5 | -14.6 | -50.0 | -16.0 | +57.0 | +43.1 | +29.7 | -8.1 | +20.1 | -1.0 | -42.7 | +5.6 |
| 2024 | -31.3 | +16.4 | -1.8 | -17.5 | -18.3 | -4.6 | +11.2 | -11.0 | +17.5 | +9.9 | -23.7 | +7.6 |
| 2025 | -3.6 | +2.5 | -24.0 | -19.6 | +3.3 | +23.7 | -12.9 | +7.6 | -4.4 | -1.9 | +145.2 | +9.5 |
| 2026 | -6.0 | -11.3 | +92.1 | +15.2 | +0.4 | -0.2 | -20.4 | -18.5 | -8.2 | -0.8 | +9.7 |
Compare stocks
Market cap
$297.88M
-
-
-
Price / Earnings ratio
6.00
-
-
-
Price / Sales ratio
0.32
-
-
-
Dividend yield
0.00%
-
-
-
Average volume
1,049,012
-
-
-
Earnings per share
$0.66
-
-
-