Applied Materials (AMAT) Stock
Key stats
- Market cap
- $253.36B
- Price / Earnings ratio
- 31.6x
- EPS (TTM)
- $11.67
- Volume
- Loading
- 52-week high
- $739.67
- 52-week low
- $203.40
- Dividend yield
- 0.62%
- Dividend amount (latest)
- $0.53
- EPS vs analyst estimate
- +3.3%Q4 FY25 · $2.17 vs $2.10
- Next earnings report
- 12 Nov 2026
Source: third-party data provider, as of November 6, 2026
EPS estimate: analyst consensus
Compare with AMAT
Recent news

Applied Materials Just Dropped 29% In a Month: Will November 12 Earnings Rescue or Break AMAT Stock?
Applied Materials Just Dropped 29% In a Month: Will November 12 Earnings Rescue or Break AMAT Stock?
AMAT
Applied Materials (AMAT) Dips More Than Broader Market: What You Should Know
Applied Materials (AMAT) Dips More Than Broader Market: What You Should Know
AMAT
Applied Materials, Inc. (AMAT) is Attracting Investor Attention: Here is What You Should Know
Applied Materials, Inc. (AMAT) is Attracting Investor Attention: Here is What You Should Know
AMAT
Applied Materials vs. Taiwan Semiconductor Manufacturing: Comparing Revenue Growth Trends Between These Artificial Intelligence Companies
Applied Materials vs. Taiwan Semiconductor Manufacturing: Comparing Revenue Growth Trends Between These Artificial Intelligence Companies
AMATNews tone: automated (AI) classification of the article's content, not a price prediction.
Technical indicators
- RSI 14
- 25.87
- MACD 12/26/9
- -30.11
- EMA 9 of MACD
- -24.33
- MACD histogram
- -5.78
- SMA 50
- $447.84
- Price below SMA 50
- EMA 50
- $443.08
- Price below EMA 50
- SMA 200
- $445.28
- Price below SMA 200
- EMA 200
- $416.68
- Price below EMA 200
Calculated by Gotrade from daily closing prices, as of November 5, 2026. Technical data, not a recommendation.
Analyst ratings
Analyst consensus: Buy
Based on 18 analyst ratings
Third-party analyst opinion, not a recommendation from Gotrade.
Financials
Performance
Debt & Balance Sheet
Revenue to Profit
2025Earnings
The market is expecting earnings per share of $2.66 for this quarter. The company has not yet shared when it is announcing earnings.
Source: third-party data provider
Latest news
Applied Materials Just Dropped 29% In a Month: Will November 12 Earnings Rescue or Break AMAT Stock?
Applied Materials Just Dropped 29% In a Month: Will November 12 Earnings Rescue or Break AMAT Stock?
AMATApplied Materials (AMAT) Dips More Than Broader Market: What You Should Know
Applied Materials (AMAT) Dips More Than Broader Market: What You Should Know
AMATApplied Materials, Inc. (AMAT) is Attracting Investor Attention: Here is What You Should Know
Applied Materials, Inc. (AMAT) is Attracting Investor Attention: Here is What You Should Know
AMATApplied Materials vs. Taiwan Semiconductor Manufacturing: Comparing Revenue Growth Trends Between These Artificial Intelligence Companies
Applied Materials vs. Taiwan Semiconductor Manufacturing: Comparing Revenue Growth Trends Between These Artificial Intelligence Companies
AMAT
Chip Equipment Stocks Rally as SK Hynix Signals Memory Shortage Into 2030: Lam Research Jumps 5%, Applied Materials Climbs 4%, KLA Gains 3%
Chip Equipment Stocks Rally as SK Hynix Signals Memory Shortage Into 2030: Lam Research Jumps 5%, Applied Materials Climbs 4%, KLA Gains 3%
AMAT
Is Applied Materials (AMAT) a Buy as Wall Street Analysts Look Optimistic?
Is Applied Materials (AMAT) a Buy as Wall Street Analysts Look Optimistic?
AMAT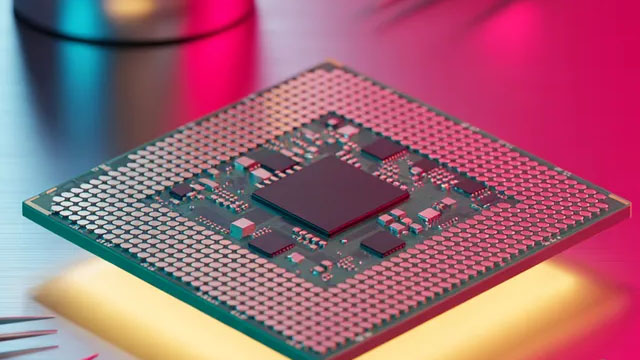
Shares in BE Semiconductor jump over 9% after Applied Materials raises stake to 20%
Shares in BE Semiconductor jump over 9% after Applied Materials raises stake to 20%
AMAT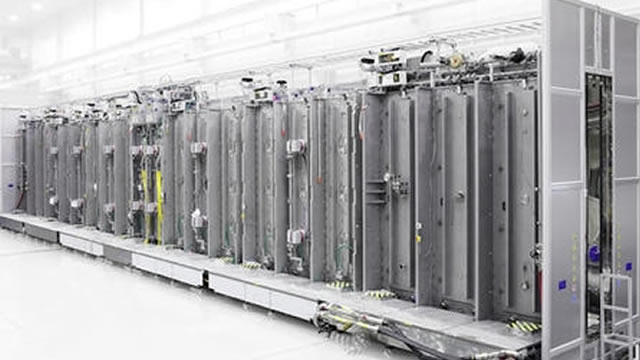
Applied Materials (AMAT) Surpasses Market Returns: Some Facts Worth Knowing
Applied Materials (AMAT) Surpasses Market Returns: Some Facts Worth Knowing
AMAT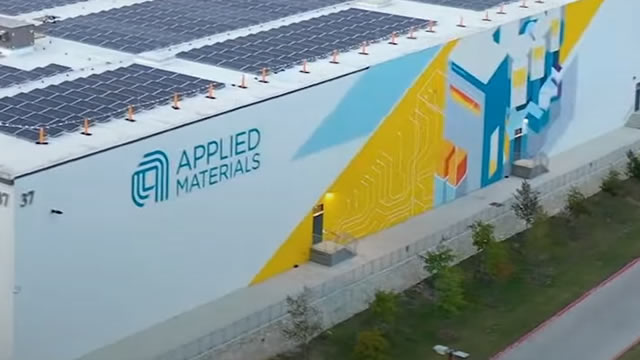
Applied Materials to raise BESI stake to about 20%
Applied Materials to raise BESI stake to about 20%
AMAT
AI Stocks Surge, Then Plunge: Which of 4 Sectors Is Worth Buying?
AI Stocks Surge, Then Plunge: Which of 4 Sectors Is Worth Buying?
AMATNews tone: automated (AI) classification of the article's content, not a price prediction.
About Applied Materials
Applied Materials is the leader in materials engineering solutions used to produce virtually every new chip and advanced display in the world. Our expertise in modifying materials at atomic levels and on an industrial scale enables customers to transform possibilities into reality. Our innovations make possible™ the technology shaping the future.
Key Executives
| Name | Title | Year Born |
|---|---|---|
| Mr. Gary E. Dickerson | President, CEO & Executive Director | 1957 |
| Dr. Omkaram Nalamasu Ph.D. | SVP, CTO, President Applied Ventures, LLC & Chair of the Growth Technical Advisory Board | 1958 |
| Mr. Brice A. Hill | Senior VP, CFO & Global Information Services | 1967 |
| Mr. Charles W. Read | Corporate VP of Business Units & Operations CFO | 1966 |
| Dr. Prabu G. Raja Ph.D. | President of Semiconductor Products Group | 1963 |
| Mr. Timothy M. Deane | Senior Vice President of Applied Global Services | 1966 |
| Mr. Adam Sanders | VP, Corporate Controller & Chief Accounting Officer | 1972 |
| Ms. Teri A. Little J.D. | Senior VP, Chief Legal Officer & Corporate Secretary | 1965 |
| Mr. Joseph M. Pon | Chief Public Affairs Officer and Corporate VP of Communications & Public Affairs | — |
| Ms. Joji Sekhon Gill | Senior VP & Chief Human Resources Officer | 1965 |
Fundamentals
Valuation
Profitability
Trading
Dividend
Source: third-party data provider, as of November 6, 2026
Technical indicators
- RSI 14
- 25.87
- MACD 12/26/9
- -30.11
- EMA 9 of MACD
- -24.33
- MACD histogram
- -5.78
- SMA 50
- $447.84
- Price below SMA 50
- EMA 50
- $443.08
- Price below EMA 50
- SMA 200
- $445.28
- Price below SMA 200
- EMA 200
- $416.68
- Price below EMA 200
Calculated by Gotrade from daily closing prices, as of November 5, 2026. Technical data, not a recommendation.
Analyst views
18 analyst ratings
Third-party analyst opinion, not a recommendation from Gotrade.
- Low
- $538.00
- Average
- $649.59
- High
- $850.00
Seasonality
Monthly price change (%)| Jan | Feb | Mar | Apr | May | Jun | Jul | Aug | Sep | Oct | Nov | Dec | |
|---|---|---|---|---|---|---|---|---|---|---|---|---|
| 2021 | -3.8 | +3.8 | ||||||||||
| 2022 | -13.6 | -3.2 | +1.7 | -13.4 | +3.8 | -20.5 | +22.8 | -11.6 | -10.8 | +2.4 | +22.1 | -9.0 |
| 2023 | +15.3 | -2.4 | +4.8 | -7.6 | +18.0 | +7.2 | +4.2 | +0.1 | -10.1 | -5.1 | +10.7 | +6.9 |
| 2024 | +6.4 | +20.8 | -1.9 | -4.8 | +10.9 | +10.2 | -10.6 | +0.5 | +10.2 | -7.9 | -4.7 | -11.3 |
| 2025 | +10.1 | -11.6 | -4.6 | +3.5 | +5.2 | +16.4 | -2.0 | -10.7 | +29.9 | +7.1 | +6.1 | +0.9 |
| 2026 | +19.9 | +13.4 | -8.2 | +11.5 | +15.7 | +57.8 | -22.0 | -11.5 | +15.7 | -26.3 | -14.8 |