Battalion Oil Corporation (BATL) Stock
AMEX · BATL
Key stats
- Market cap
- $41.41M
- Price / Earnings ratio
- -0.5x
- EPS (TTM)
- -$5.05
- Volume
- Loading
- 52-week high
- $29.70
- 52-week low
- $0.67
Source: third-party data provider, as of November 13, 2026
Compare with BATL
Recent news

Stocktwits
Why Are BATL, TPET, XOM, CVX, USO, UCO Stocks Rising Overnight?
BATLJuly 20, 2026
Stocktwits
Why Are BATL, TPET, XOM, CVX, USO, UCO Stocks Rising Overnight?
BATL
Stocktwits
BATL, TPET, WTI, XOM, USO Stocks Climb Amid Escalating US-Iran Conflict: Oil Nears $80 A Barrel
BATLJuly 13, 2026
Stocktwits
BATL, TPET, WTI, XOM, USO Stocks Climb Amid Escalating US-Iran Conflict: Oil Nears $80 A Barrel
BATL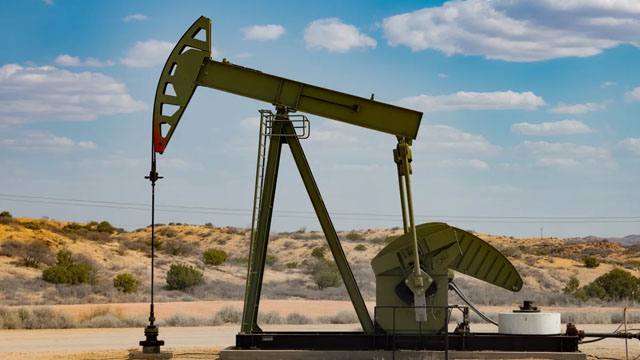
MarketBeat
3 Beaten-Down Trades That Could Pay Off in a Market Correction
BATLJuly 8, 2026
MarketBeat
3 Beaten-Down Trades That Could Pay Off in a Market Correction
BATL
Stocktwits
S&P 500, Nasdaq End Higher To Record Best Quarter Since 2020, While Alphabet Debut Drives Dow — VZ, CMCSA, RKLB, SMCI, BATL, GOOGL In Focus
BATLJune 29, 2026
Stocktwits
S&P 500, Nasdaq End Higher To Record Best Quarter Since 2020, While Alphabet Debut Drives Dow — VZ, CMCSA, RKLB, SMCI, BATL, GOOGL In Focus
BATLTechnical indicators
- RSI 14
- 35.65
- MACD 12/26/9
- -0.09
- EMA 9 of MACD
- -0.08
- MACD histogram
- -0.00
- SMA 50
- $1.03
- Price below SMA 50
- EMA 50
- $1.02
- Price below EMA 50
- SMA 200
- $3.29
- Price below SMA 200
- EMA 200
- $2.41
- Price below EMA 200
Calculated by Gotrade from daily closing prices, as of November 11, 2026. Technical data, not a recommendation.
Analyst ratings
No analyst data available
Financials
Performance
Revenue
Net income
Net margin %
2021
2022
2023
2024
2025
431M284M142M0
Debt & Balance Sheet
Total assets
Total liabilities
2021
2022
2023
2024
2025
592M391M195M0
Revenue to Profit
2025$166.0M
Revenue$0.0
Cost of revenue$114.8M
Gross profit$0.0
Operating expenses$11.9M
Net incomeEarnings
No data available
Source: third-party data provider
Latest news
Stocktwits
Why Are BATL, TPET, XOM, CVX, USO, UCO Stocks Rising Overnight?
BATLJuly 20, 2026
Stocktwits
Why Are BATL, TPET, XOM, CVX, USO, UCO Stocks Rising Overnight?
BATLStocktwits
BATL, TPET, WTI, XOM, USO Stocks Climb Amid Escalating US-Iran Conflict: Oil Nears $80 A Barrel
BATLJuly 13, 2026
Stocktwits
BATL, TPET, WTI, XOM, USO Stocks Climb Amid Escalating US-Iran Conflict: Oil Nears $80 A Barrel
BATLMarketBeat
3 Beaten-Down Trades That Could Pay Off in a Market Correction
BATLJuly 8, 2026
MarketBeat
3 Beaten-Down Trades That Could Pay Off in a Market Correction
BATLStocktwits
S&P 500, Nasdaq End Higher To Record Best Quarter Since 2020, While Alphabet Debut Drives Dow — VZ, CMCSA, RKLB, SMCI, BATL, GOOGL In Focus
BATLJune 29, 2026
Stocktwits
S&P 500, Nasdaq End Higher To Record Best Quarter Since 2020, While Alphabet Debut Drives Dow — VZ, CMCSA, RKLB, SMCI, BATL, GOOGL In Focus
BATL
Stocktwits
BATL Stock Jumps To Near Three-Week High — WTI Rally, Russell Microcap Inclusion Fuel Gains
BATLJune 29, 2026
Stocktwits
BATL Stock Jumps To Near Three-Week High — WTI Rally, Russell Microcap Inclusion Fuel Gains
BATLStocktwits
Why Are BATL, INDO, XOM, CVX, USO, UCO Rising Overnight?
BATLJune 8, 2026
Stocktwits
Why Are BATL, INDO, XOM, CVX, USO, UCO Rising Overnight?
BATLStocktwits
BATL, USO, UCO Edge Higher As Oil Gains: Exxon Executive Warns Shrinking Inventories Could Send Crude To $160
BATLJune 1, 2026
Stocktwits
BATL, USO, UCO Edge Higher As Oil Gains: Exxon Executive Warns Shrinking Inventories Could Send Crude To $160
BATLStocktwits
USO, UCO, BATL, XOM Slip: Oil Dips Below $100 After Trump Says Iran Talks ‘Proceeding Nicely’
BATLMay 26, 2026
Stocktwits
USO, UCO, BATL, XOM Slip: Oil Dips Below $100 After Trump Says Iran Talks ‘Proceeding Nicely’
BATL
24/7 Wall Street
You're Sleeping on This Stock—I'm Not
BATLApril 23, 2026
24/7 Wall Street
You're Sleeping on This Stock—I'm Not
BATLStocktwits
Physical Oil Markets Have Already Priced In US-Iran War, But Paper Markets Haven't, Says Veteran Investor: 'Repricing Will Be VIOLENT'
BATLApril 22, 2026
Stocktwits
Physical Oil Markets Have Already Priced In US-Iran War, But Paper Markets Haven't, Says Veteran Investor: 'Repricing Will Be VIOLENT'
BATLAbout Battalion Oil Corporation
Battalion Oil Corp is an independent energy company focused on the acquisition, production, exploration, and development of onshore liquids-rich oil and natural gas assets in the U.S. Its properties and drilling activities are currently focused in the Delaware Basin.
SectorEnergy
IndustryOil & Gas E&P
Employees40
CEOMr. Matthew B. Steele
IPO DateDec 24, 2019
HeadquartersHouston, TX
Key Executives
| Name | Title | Year Born |
|---|---|---|
| Mr. Matthew B. Steele | Principal Financial Officer, CEO & Director | 1979 |
| Mr. Daniel P. Rohling | Executive VP & COO | 1983 |
| Mr. Walter Randolph Mayer | Senior VP, General Counsel & Secretary | 1976 |
| John-Davis Rutkauskas | Director of Corporate Finance & Investor Relations | — |
| Mr. Charles E. Martin | VP & Controller | — |
Fundamentals
Valuation
Price-to-sales ratio0.22
Price-to-book value0.20
Profitability
Return on Equity-108.00%
Return on Assets-19.00%
Return on Sales-10.00%
Gross margin (latest quarter)79.62%
EBITDA$33.12M
Trading
Average volume3,905,064
Source: third-party data provider, as of November 13, 2026
Technical indicators
- RSI 14
- 35.65
- MACD 12/26/9
- -0.09
- EMA 9 of MACD
- -0.08
- MACD histogram
- -0.00
- SMA 50
- $1.03
- Price below SMA 50
- EMA 50
- $1.02
- Price below EMA 50
- SMA 200
- $3.29
- Price below SMA 200
- EMA 200
- $2.41
- Price below EMA 200
Calculated by Gotrade from daily closing prices, as of November 11, 2026. Technical data, not a recommendation.
Analyst views
No analyst data available
Seasonality
Monthly price change (%)| Jan | Feb | Mar | Apr | May | Jun | Jul | Aug | Sep | Oct | Nov | Dec | |
|---|---|---|---|---|---|---|---|---|---|---|---|---|
| 2026 | +35.0 | -66.9 | -1.6 | -61.2 | -20.1 | +12.4 | -4.3 | -23.4 | -8.6 | -11.1 |
Compare stocks
Market cap
$41.41M
-
-
-
Price / Earnings ratio
-0.50
-
-
-
Price / Sales ratio
0.22
-
-
-
Dividend yield
0.00%
-
-
-
Average volume
3,905,064
-
-
-
Earnings per share
$-5.05
-
-
-


















