Bruker (BRKR) Stock
Key stats
- Market cap
- $9.53B
- Price / Earnings ratio
- -56.8x
- EPS (TTM)
- -$1.10
- Volume
- Loading
- 52-week high
- $68.98
- 52-week low
- $32.37
- Dividend yield
- 0.32%
- Dividend amount (latest)
- $0.05
Source: third-party data provider, as of November 13, 2026
Compare with BRKR
Recent news

Bruker Announces Date and Time of Third Quarter 2026 Earnings Release and Webcast
Bruker Announces Date and Time of Third Quarter 2026 Earnings Release and Webcast
BRKR
Bruker Gains 66.3% in a Year: What's Driving the Rally?
Bruker Gains 66.3% in a Year: What's Driving the Rally?
BRKR
Untargeted timsTOF Mass Spectrometry Enables Discovery and Mapping of Draft Atlas of the Human Plasma Proteome at Proteoform Resolution
Untargeted timsTOF Mass Spectrometry Enables Discovery and Mapping of Draft Atlas of the Human Plasma Proteome at Proteoform Resolution
BRKR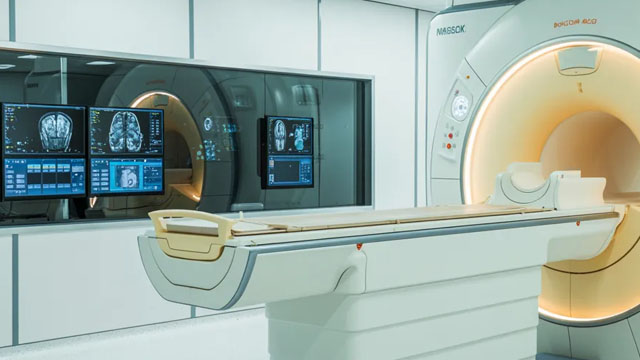
Why Bruker (BRKR) is a Top Momentum Stock for the Long-Term
Why Bruker (BRKR) is a Top Momentum Stock for the Long-Term
BRKRNews tone: automated (AI) classification of the article's content, not a price prediction.
Technical indicators
- RSI 14
- 53.94
- MACD 12/26/9
- 0.96
- EMA 9 of MACD
- 0.39
- MACD histogram
- 0.57
- SMA 50
- $59.41
- Price above SMA 50
- EMA 50
- $59.31
- Price above EMA 50
- SMA 200
- $50.66
- Price above SMA 200
- EMA 200
- $52.38
- Price above EMA 200
Calculated by Gotrade from daily closing prices, as of November 11, 2026. Technical data, not a recommendation.
Analyst ratings
Analyst consensus: Hold
Based on 7 analyst ratings
Third-party analyst opinion, not a recommendation from Gotrade.
Financials
Performance
Debt & Balance Sheet
Revenue to Profit
2025Earnings
The market is expecting earnings per share of $0.56 for this quarter. The company has not yet shared when it is announcing earnings.
Source: third-party data provider
Latest news
Bruker Announces Date and Time of Third Quarter 2026 Earnings Release and Webcast
Bruker Announces Date and Time of Third Quarter 2026 Earnings Release and Webcast
BRKRBruker Gains 66.3% in a Year: What's Driving the Rally?
Bruker Gains 66.3% in a Year: What's Driving the Rally?
BRKRUntargeted timsTOF Mass Spectrometry Enables Discovery and Mapping of Draft Atlas of the Human Plasma Proteome at Proteoform Resolution
Untargeted timsTOF Mass Spectrometry Enables Discovery and Mapping of Draft Atlas of the Human Plasma Proteome at Proteoform Resolution
BRKRWhy Bruker (BRKR) is a Top Momentum Stock for the Long-Term
Why Bruker (BRKR) is a Top Momentum Stock for the Long-Term
BRKR
Bruker Advances Functional Proteomics with Novel timsUltra AIP and timsOmni Workflows for Drug Discovery & Development and Disease Biology Research
Bruker Advances Functional Proteomics with Novel timsUltra AIP and timsOmni Workflows for Drug Discovery & Development and Disease Biology Research
BRKR
Bruker Sees AI-Fueled Semiconductor Demand, Targets Critical Q4 Revenue Rebound
Bruker Sees AI-Fueled Semiconductor Demand, Targets Critical Q4 Revenue Rebound
BRKR
Bruker Receives Order for High-Field NMR Systems for Major Upgrade of Magnetic Resonance Research Infrastructure at UC Berkeley
Bruker Receives Order for High-Field NMR Systems for Major Upgrade of Magnetic Resonance Research Infrastructure at UC Berkeley
BRKR
Bruker Corporation to Present at Upcoming Investor Conferences
Bruker Corporation to Present at Upcoming Investor Conferences
BRKR
BEST and Luvata Announce Collaboration Agreement for Supply of High-Performance RRP® Superconductors for Magnetic Confinement Fusion
BEST and Luvata Announce Collaboration Agreement for Supply of High-Performance RRP® Superconductors for Magnetic Confinement Fusion
BRKR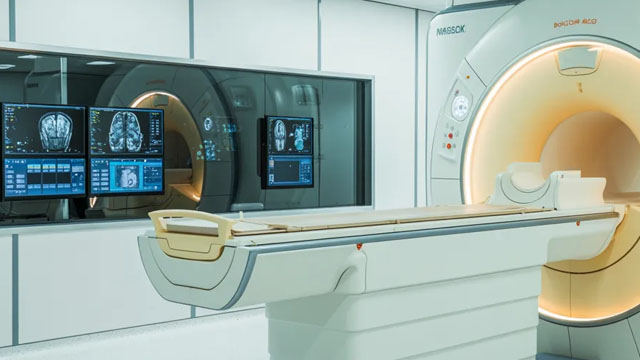
Why Is Bruker (BRKR) Up 12.5% Since Last Earnings Report?
Why Is Bruker (BRKR) Up 12.5% Since Last Earnings Report?
BRKRNews tone: automated (AI) classification of the article's content, not a price prediction.
About Bruker
Bruker Corp manufactures scientific instruments and diagnostic tests for customers in the life sciences, applied markets, pharmaceutical, and biotechnology industries. The company operates in segments, namely, Bruker Scientific Instruments (BSI) BioSpin, BSI CALID, BSI Nano, and Supercon Technologies (BEST). The company generates maximum revenue from the BSI CALID segment. Geographically, it derives the maximum of its revenue from United States.
Key Executives
| Name | Title | Year Born |
|---|---|---|
| Dr. Frank H. Laukien Ph.D. | Chairman, CEO & President | 1960 |
| Dr. Burkhard Prause Ph.D. | President and CEO of Bruker Energy & Supercon Technologies, Inc. | 1967 |
| Mr. Gerald N. Herman CPA | Executive VP & CFO | 1958 |
| Dr. Mark R. Munch Ph.D. | Corporate Executive VP and President of Bruker Nano Group & Corporate | 1962 |
| Mr. Juergen W. Srega | President of Bruker Biosystems Group & Bruker Daltonics Division | 1955 |
| Mr. Thomas M. Bures | Chief Accounting Officer | 1975 |
| Mr. J. Brent Alldredge J.D. | Senior VP, General Counsel, Secretary & Global Head of Compliance | 1975 |
| Dr. Wolfgang Pusch Ph.D. | President of Bruker Microbiology & Infection Diagnostics Group | — |
Fundamentals
Valuation
Profitability
Trading
Dividend
Source: third-party data provider, as of November 13, 2026
Technical indicators
- RSI 14
- 53.94
- MACD 12/26/9
- 0.96
- EMA 9 of MACD
- 0.39
- MACD histogram
- 0.57
- SMA 50
- $59.41
- Price above SMA 50
- EMA 50
- $59.31
- Price above EMA 50
- SMA 200
- $50.66
- Price above SMA 200
- EMA 200
- $52.38
- Price above EMA 200
Calculated by Gotrade from daily closing prices, as of November 11, 2026. Technical data, not a recommendation.
Analyst views
7 analyst ratings
Third-party analyst opinion, not a recommendation from Gotrade.
- Low
- $60.00
- Average
- $68.29
- High
- $85.00
Seasonality
Monthly price change (%)| Jan | Feb | Mar | Apr | May | Jun | Jul | Aug | Sep | Oct | Nov | Dec | |
|---|---|---|---|---|---|---|---|---|---|---|---|---|
| 2021 | -1.7 | +3.6 | ||||||||||
| 2022 | -17.8 | +4.7 | -7.7 | -11.5 | +7.7 | +2.2 | +7.9 | -18.9 | -5.7 | +13.8 | +7.1 | +1.0 |
| 2023 | +1.5 | -3.4 | +16.9 | +1.4 | -12.0 | +4.2 | -5.5 | -6.5 | -5.5 | -8.3 | +14.2 | +11.2 |
| 2024 | -1.1 | +19.2 | +6.4 | -16.1 | -17.1 | -1.1 | +9.9 | -1.7 | +5.1 | -15.2 | -2.3 | +0.4 |
| 2025 | -1.1 | -16.7 | -10.7 | -0.8 | -6.7 | +12.2 | -8.3 | -10.6 | -2.2 | +12.2 | +26.1 | -1.6 |
| 2026 | -7.9 | -8.3 | -9.3 | +1.7 | +60.1 | +3.0 | +3.6 | -9.8 | +15.6 | -7.9 | +12.1 |
Corporate actions
Upcoming
No upcoming corporate actions for BRKR