
Carnival (CCL) Stock
Key stats
- Market cap
- $41.43B
- Price / Earnings ratio
- 12.7x
- EPS (TTM)
- $2.31
- Volume
- Loading
- 52-week high
- $34.03
- 52-week low
- $21.45
- Dividend yield
- 1.95%
- Dividend amount (latest)
- $0.15
- EPS vs analyst estimate
- +8.3%Q3 FY25 · $1.43 vs $1.32
Source: third-party data provider, as of November 10, 2026
EPS estimate: analyst consensus
Compare with CCL
Recent news
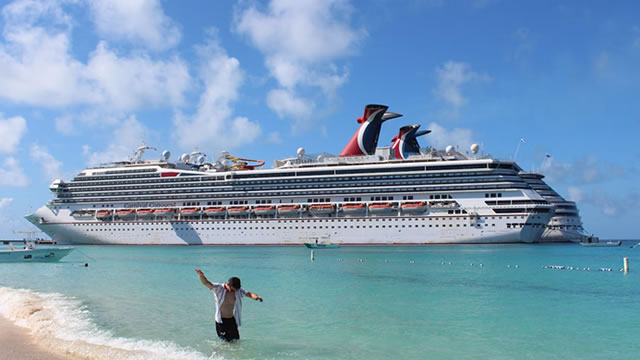
Carnival (CCL) Stock Falls Amid Market Uptick: What Investors Need to Know
Carnival (CCL) Stock Falls Amid Market Uptick: What Investors Need to Know
CCL
Carnival and Royal Caribbean Climb 5%, Norwegian Cruise Line Rises 4% as Oil Prices Drop
Carnival and Royal Caribbean Climb 5%, Norwegian Cruise Line Rises 4% as Oil Prices Drop
CCL
Cruise companies aim to keep fuel costs down. Their strategies for doing so differ
Cruise companies aim to keep fuel costs down. Their strategies for doing so differ
CCL
Why Is Carnival (CCL) Up 14.3% Since Last Earnings Report?
Why Is Carnival (CCL) Up 14.3% Since Last Earnings Report?
CCLNews tone: automated (AI) classification of the article's content, not a price prediction.
Technical indicators
- RSI 14
- 65.92
- MACD 12/26/9
- 1.33
- EMA 9 of MACD
- 1.14
- MACD histogram
- 0.20
- SMA 50
- $25.40
- Price above SMA 50
- EMA 50
- $26.83
- Price above EMA 50
- SMA 200
- $27.12
- Price above SMA 200
- EMA 200
- $27.02
- Price above EMA 200
Calculated by Gotrade from daily closing prices, as of November 9, 2026. Technical data, not a recommendation.
Analyst ratings
Analyst consensus: Buy
Based on 14 analyst ratings
Third-party analyst opinion, not a recommendation from Gotrade.
Financials
Performance
Debt & Balance Sheet
Revenue to Profit
2025Earnings
The market is expecting earnings per share of $1.43 for this quarter. The company has not yet shared when it is announcing earnings.
Source: third-party data provider
Latest news
Carnival (CCL) Stock Falls Amid Market Uptick: What Investors Need to Know
Carnival (CCL) Stock Falls Amid Market Uptick: What Investors Need to Know
CCLCarnival and Royal Caribbean Climb 5%, Norwegian Cruise Line Rises 4% as Oil Prices Drop
Carnival and Royal Caribbean Climb 5%, Norwegian Cruise Line Rises 4% as Oil Prices Drop
CCLCruise companies aim to keep fuel costs down. Their strategies for doing so differ
Cruise companies aim to keep fuel costs down. Their strategies for doing so differ
CCLWhy Is Carnival (CCL) Up 14.3% Since Last Earnings Report?
Why Is Carnival (CCL) Up 14.3% Since Last Earnings Report?
CCL
Norwegian Surges 11% as Earnings Beat Lifts Full-Year Outlook; Royal Caribbean Rises 3%, Carnival Edges Higher
Norwegian Surges 11% as Earnings Beat Lifts Full-Year Outlook; Royal Caribbean Rises 3%, Carnival Edges Higher
CCL
Carnival (CCL) Outpaces Stock Market Gains: What You Should Know
Carnival (CCL) Outpaces Stock Market Gains: What You Should Know
CCL
Better Cruise Stock Buy: Carnival or a 50/50 Split of Royal Caribbean and Norwegian Cruise Line?
Better Cruise Stock Buy: Carnival or a 50/50 Split of Royal Caribbean and Norwegian Cruise Line?
CCL
Royal Caribbean Surges 8% as Earnings Beat Lifts Full-Year Outlook; Norwegian Climbs 3%, Carnival Edges Higher
Royal Caribbean Surges 8% as Earnings Beat Lifts Full-Year Outlook; Norwegian Climbs 3%, Carnival Edges Higher
CCL
Carnival (CCL) Exceeds Market Returns: Some Facts to Consider
Carnival (CCL) Exceeds Market Returns: Some Facts to Consider
CCL
Carnival vs. Royal Caribbean: Which Cruise Line Stock Has an Edge Now?
Carnival vs. Royal Caribbean: Which Cruise Line Stock Has an Edge Now?
CCLNews tone: automated (AI) classification of the article's content, not a price prediction.
About Carnival
Carnival Corporation & plc, the world’s largest leisure travel company, provides travelers around the globe with extraordinary vacations at an exceptional value. The company’s portfolio of global cruise line brands includes Carnival Cruise Line, Princess Cruises, Holland America Line, Seabourn, P&O Cruises (Australia), Costa Cruises, AIDA Cruises, P&O Cruises (UK) and Cunard. Carnival Corporation also operates Holland America Princess Alaska Tours, the leading tour company in Alaska and the Canadian Yukon.
Key Executives
| Name | Title | Year Born |
|---|---|---|
| Mr. Joshua Ian Weinstein | CEO & Director | 1974 |
| Mr. Michael Meir Arison | Executive Chairman of the Board | 1949 |
| Mr. David Bernstein | CFO & Chief Accounting Officer | 1958 |
| Mr. Enrique Miguez J.D. | Chief Legal & Administrative Officer | 1965 |
| Ms. Bettina A. Deynes | Global Chief Human Resources Officer | 1973 |
| Mr. Lars Ljoen | Chief Maritime Officer | 1970 |
| Ms. Beth Roberts | Senior Vice President of Investor Relations | — |
| Ms. Jody Venturoni | Chief Communications Officer | — |
| Hon. E. H. Horst Rahe | Life President of AIDA Cruises | — |
| Mr. Adolfo M. Perez | Senior Vice President of Trade Sales and Marketing for Carnival Cruise Line | — |
Fundamentals
Valuation
Profitability
Trading
Dividend
Source: third-party data provider, as of November 10, 2026
Technical indicators
- RSI 14
- 65.92
- MACD 12/26/9
- 1.33
- EMA 9 of MACD
- 1.14
- MACD histogram
- 0.20
- SMA 50
- $25.40
- Price above SMA 50
- EMA 50
- $26.83
- Price above EMA 50
- SMA 200
- $27.12
- Price above SMA 200
- EMA 200
- $27.02
- Price above EMA 200
Calculated by Gotrade from daily closing prices, as of November 9, 2026. Technical data, not a recommendation.
Analyst views
14 analyst ratings
Third-party analyst opinion, not a recommendation from Gotrade.
- Low
- $29.00
- Average
- $33.61
- High
- $42.00
Seasonality
Monthly price change (%)| Jan | Feb | Mar | Apr | May | Jun | Jul | Aug | Sep | Oct | Nov | Dec | |
|---|---|---|---|---|---|---|---|---|---|---|---|---|
| 2021 | -25.0 | +22.8 | ||||||||||
| 2022 | -7.5 | -2.9 | +7.2 | -13.7 | -20.0 | -35.8 | +2.7 | +6.1 | -24.8 | +32.3 | +9.7 | -19.2 |
| 2023 | +35.8 | -6.3 | -4.2 | -7.6 | +18.3 | +58.9 | -0.6 | -12.1 | -12.8 | -16.0 | +33.3 | +17.6 |
| 2024 | -4.1 | -5.6 | +2.1 | -8.9 | +4.2 | +16.9 | -5.9 | +4.7 | +13.1 | +22.1 | +16.1 | -4.1 |
| 2025 | +10.6 | -11.5 | -16.0 | -5.4 | +24.6 | +19.5 | +3.9 | +9.7 | -7.2 | +1.7 | -10.2 | +17.8 |
| 2026 | -2.9 | -2.8 | -11.2 | -0.3 | +5.3 | +3.9 | -2.5 | -16.9 | +5.6 | +15.0 | -1.6 |