
Chord Energy (CHRD) Stock
Key stats
- Market cap
- $7.63B
- Price / Earnings ratio
- 8.2x
- EPS (TTM)
- $15.96
- Volume
- Loading
- 52-week high
- $159.96
- 52-week low
- $87.35
- Dividend yield
- 3.62%
- Dividend amount (latest)
- $1.30
- EPS vs analyst estimate
- +3.5%Q3 FY25 · $2.35 vs $2.27
Source: third-party data provider, as of November 13, 2026
EPS estimate: analyst consensus
Compare with CHRD
Recent news
Chord Energy's Q3 Earnings on Deck: Should You Bet on the Stock?
Chord Energy's Q3 Earnings on Deck: Should You Bet on the Stock?
CHRD
Chord Energy Corporation (CHRD) Earnings Expected to Grow: Should You Buy?
Chord Energy Corporation (CHRD) Earnings Expected to Grow: Should You Buy?
CHRD
Are Investors Undervaluing Chord Energy Corporation (CHRD) Right Now?
Are Investors Undervaluing Chord Energy Corporation (CHRD) Right Now?
CHRD
A 70% Rally Isn't Chord Energy's Only Selling Point
A 70% Rally Isn't Chord Energy's Only Selling Point
CHRDNews tone: automated (AI) classification of the article's content, not a price prediction.
Technical indicators
- RSI 14
- 48.86
- MACD 12/26/9
- -1.83
- EMA 9 of MACD
- -0.37
- MACD histogram
- -1.46
- SMA 50
- $144.94
- Price below SMA 50
- EMA 50
- $143.76
- Price below EMA 50
- SMA 200
- $133.05
- Price above SMA 200
- EMA 200
- $129.89
- Price above EMA 200
Calculated by Gotrade from daily closing prices, as of November 11, 2026. Technical data, not a recommendation.
Analyst ratings
Analyst consensus: Buy
Based on 10 analyst ratings
Third-party analyst opinion, not a recommendation from Gotrade.
Financials
Performance
Debt & Balance Sheet
Revenue to Profit
2025Earnings
The market is expecting earnings per share of $1.50 for this quarter. The company has not yet shared when it is announcing earnings.
Source: third-party data provider
Latest news
Chord Energy's Q3 Earnings on Deck: Should You Bet on the Stock?
Chord Energy's Q3 Earnings on Deck: Should You Bet on the Stock?
CHRDChord Energy Corporation (CHRD) Earnings Expected to Grow: Should You Buy?
Chord Energy Corporation (CHRD) Earnings Expected to Grow: Should You Buy?
CHRDAre Investors Undervaluing Chord Energy Corporation (CHRD) Right Now?
Are Investors Undervaluing Chord Energy Corporation (CHRD) Right Now?
CHRDA 70% Rally Isn't Chord Energy's Only Selling Point
A 70% Rally Isn't Chord Energy's Only Selling Point
CHRD
5 Strong Buy Growth Stocks With High Margins to Grab Before Earnings
5 Strong Buy Growth Stocks With High Margins to Grab Before Earnings
CHRD
Why Chord Energy Corporation (CHRD) Might be Well Poised for a Surge
Why Chord Energy Corporation (CHRD) Might be Well Poised for a Surge
CHRD
Best Momentum Stock to Buy for October 21st
Best Momentum Stock to Buy for October 21st
CHRD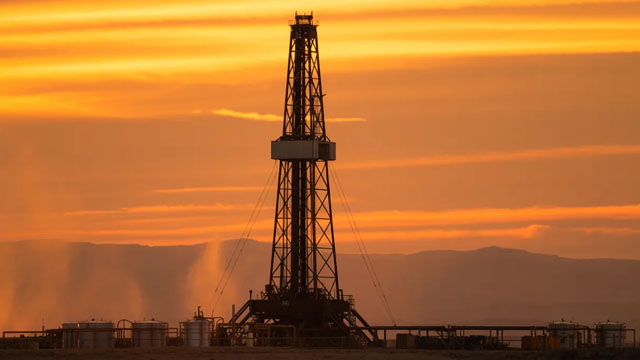
Best Value Stocks to Buy for October 21st
Best Value Stocks to Buy for October 21st
CHRD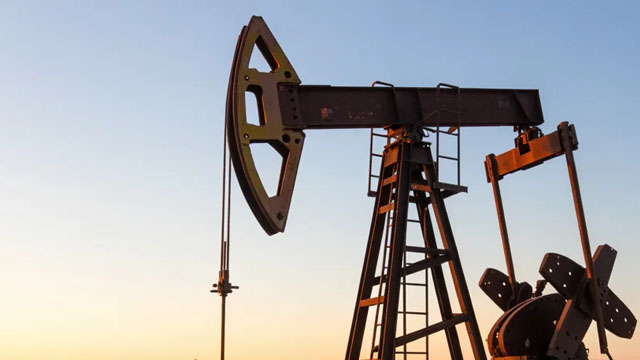
Best Income Stock to Buy for October 21st
Best Income Stock to Buy for October 21st
CHRD
New Strong Buy Stocks for October 21st
New Strong Buy Stocks for October 21st
CHRDNews tone: automated (AI) classification of the article's content, not a price prediction.
About Chord Energy
Chord Energy is a scaled unconventional U.S. oil producer with a premier Williston Basin acreage position. Led by a management team with extensive industry experience, Chord acquires, exploits, develops, and explores for crude oil, natural gas, and natural gas liquids, helping to supply the energy that powers and improves daily life around the world. As a top-tier operator, we create value for our shareholders, opportunities for our team members, and positive impacts in our communities with a commitment to excellence and a continuous improvement approach. Innovation, collaboration, diverse views, and teamwork inform every area of our purpose-driven work that puts the safety and well being of people and the environment first.
Key Executives
| Name | Title | Year Born |
|---|---|---|
| Mr. Richard N. Robuck | Executive VP, CFO & Treasurer | 1974 |
| Mr. Darrin J. Henke | Executive VP & COO | 1967 |
| Mr. Michael H. Lou | Executive VP, Chief Strategy Officer & Chief Commercial Officer | 1974 |
| Ms. Lara J. Kroll | Chief Accounting Officer & Senior VP | 1978 |
| Mr. Jonathan Lancton | Senior VP & General Counsel | — |
| Mr. Gilbert Delarosa | Vice President of Marketing | — |
| Ms. Elizabeth Shuler | Senior VP & Chief Human Resources Officer | — |
| Mr. Jason C. Swaren | Senior VP of Production | — |
| Mr. Kevin A. Kelly | Senior Vice President of Environment & Sustainability | — |
| Mr. Alex J. Wall | Senior Vice President of Asset Management | — |
Fundamentals
Valuation
Profitability
Trading
Dividend
Source: third-party data provider, as of November 13, 2026
Technical indicators
- RSI 14
- 48.86
- MACD 12/26/9
- -1.83
- EMA 9 of MACD
- -0.37
- MACD histogram
- -1.46
- SMA 50
- $144.94
- Price below SMA 50
- EMA 50
- $143.76
- Price below EMA 50
- SMA 200
- $133.05
- Price above SMA 200
- EMA 200
- $129.89
- Price above EMA 200
Calculated by Gotrade from daily closing prices, as of November 11, 2026. Technical data, not a recommendation.
Analyst views
10 analyst ratings
Third-party analyst opinion, not a recommendation from Gotrade.
- Low
- $150.00
- Average
- $177.67
- High
- $198.00
Seasonality
Monthly price change (%)| Jan | Feb | Mar | Apr | May | Jun | Jul | Aug | Sep | Oct | Nov | Dec | |
|---|---|---|---|---|---|---|---|---|---|---|---|---|
| 2021 | -8.8 | +10.1 | ||||||||||
| 2022 | +2.6 | -6.2 | +8.5 | -11.5 | +21.2 | -26.4 | +17.3 | +11.3 | +0.5 | +6.4 | -1.5 | -7.1 |
| 2023 | +8.8 | -4.9 | -2.0 | +0.2 | +0.7 | +7.3 | +1.3 | +2.6 | -2.2 | +4.5 | -1.9 | +2.6 |
| 2024 | -8.6 | +5.9 | +8.5 | -0.5 | +6.5 | -5.1 | +1.2 | -10.9 | -7.9 | -4.2 | +3.0 | -7.8 |
| 2025 | -5.4 | +3.0 | +6.3 | -19.9 | -2.3 | +5.4 | +9.4 | +3.8 | -11.0 | -9.7 | +3.2 | -2.3 |
| 2026 | +5.9 | +12.2 | +25.5 | +6.3 | -9.1 | -17.2 | +25.8 | +5.6 | -10.9 | +14.7 | -6.0 |













