
ClearPoint Neuro, Inc. (CLPT) Stock
Key stats
- Market cap
- $281.86M
- Price / Earnings ratio
- -8.7x
- EPS (TTM)
- -$1.17
- Volume
- Loading
- 52-week high
- $28.10
- 52-week low
- $8.27
Source: third-party data provider, as of October 16, 2026
Compare with CLPT
Recent news
ClearPoint Neuro (CLPT) Reports Q2 Earnings: What Key Metrics Have to Say
ClearPoint Neuro (CLPT) Reports Q2 Earnings: What Key Metrics Have to Say
CLPT
ClearPoint Neuro, Inc. (CLPT) Reports Q2 Loss, Misses Revenue Estimates
ClearPoint Neuro, Inc. (CLPT) Reports Q2 Loss, Misses Revenue Estimates
CLPT
ClearPoint Neuro Q2 Earnings Call Highlights
ClearPoint Neuro Q2 Earnings Call Highlights
CLPT
ClearPoint Neuro (CLPT) Surges 26.0%: Is This an Indication of Further Gains?
ClearPoint Neuro (CLPT) Surges 26.0%: Is This an Indication of Further Gains?
CLPTTechnical indicators
- RSI 14
- 27.87
- MACD 12/26/9
- -1.23
- EMA 9 of MACD
- -0.96
- MACD histogram
- -0.27
- SMA 50
- $13.75
- Price below SMA 50
- EMA 50
- $13.15
- Price below EMA 50
- SMA 200
- $13.26
- Price below SMA 200
- EMA 200
- $13.92
- Price below EMA 200
Calculated by Gotrade from daily closing prices, as of October 14, 2026. Technical data, not a recommendation.
Analyst ratings
No analyst data available
Financials
Performance
Debt & Balance Sheet
Revenue to Profit
2025Earnings
The market is expecting earnings per share of -$0.20 for this quarter. The company has not yet shared when it is announcing earnings.
Source: third-party data provider
Latest news
ClearPoint Neuro (CLPT) Reports Q2 Earnings: What Key Metrics Have to Say
ClearPoint Neuro (CLPT) Reports Q2 Earnings: What Key Metrics Have to Say
CLPTClearPoint Neuro, Inc. (CLPT) Reports Q2 Loss, Misses Revenue Estimates
ClearPoint Neuro, Inc. (CLPT) Reports Q2 Loss, Misses Revenue Estimates
CLPTClearPoint Neuro Q2 Earnings Call Highlights
ClearPoint Neuro Q2 Earnings Call Highlights
CLPTClearPoint Neuro (CLPT) Surges 26.0%: Is This an Indication of Further Gains?
ClearPoint Neuro (CLPT) Surges 26.0%: Is This an Indication of Further Gains?
CLPT
Compared to Estimates, ClearPoint Neuro (CLPT) Q1 Earnings: A Look at Key Metrics
Compared to Estimates, ClearPoint Neuro (CLPT) Q1 Earnings: A Look at Key Metrics
CLPT
ClearPoint Neuro, Inc. (CLPT) Reports Q1 Loss, Lags Revenue Estimates
ClearPoint Neuro, Inc. (CLPT) Reports Q1 Loss, Lags Revenue Estimates
CLPT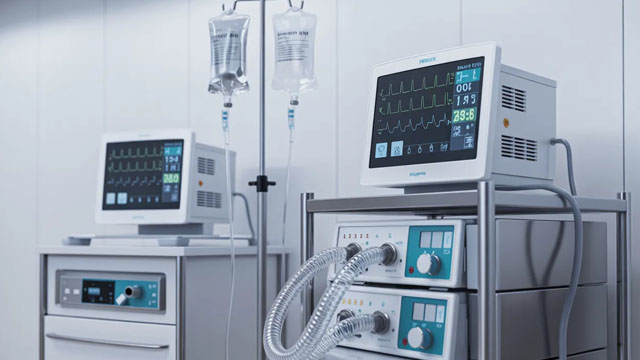
ClearPoint Neuro Q1 Earnings Call Highlights
ClearPoint Neuro Q1 Earnings Call Highlights
CLPT
ClearPoint Neuro, Inc. (CLPT) Reports Q4 Loss, Tops Revenue Estimates
ClearPoint Neuro, Inc. (CLPT) Reports Q4 Loss, Tops Revenue Estimates
CLPT
ClearPoint Neuro (CLPT) Moves 8.1% Higher: Will This Strength Last?
ClearPoint Neuro (CLPT) Moves 8.1% Higher: Will This Strength Last?
CLPT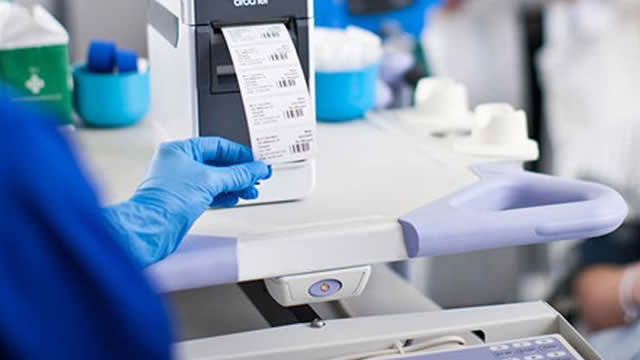
CLPT Gets EU MDR Certification for ClearPoint Navigation Software
CLPT Gets EU MDR Certification for ClearPoint Navigation Software
CLPTAbout ClearPoint Neuro, Inc.
ClearPoint Neuro Inc is a medical device company based in the United States. It develops and commercializes platforms for performing minimally invasive surgical procedures in the brain and heart under direct, intra-procedural magnetic resonance imaging (MRI) guidance. The company's ClearPoint system, which is in commercial use, is used to perform minimally invasive surgical procedures in the brain. The company's products include the ClearPoint system, ClearPoint Services, ClearPoint Disposables, ClearPoint Software, and ClearPoint Therapeutic Solutions.
Key Executives
| Name | Title | Year Born |
|---|---|---|
| Mr. Joseph Michael Burnett | President, CEO & Director | 1977 |
| Mr. Danilo D'Alessandro | Chief Financial Officer | 1985 |
| Mr. Mazin Sabra | Chief Operating Officer | 1980 |
| Mr. Jeremy L. Stigall | Chief Business Officer | 1984 |
| Ms. Ellisa Cholapranee J.D. | General Counsel & Secretary | — |
| Mr. Robert C. Korn | Senior Vice President of Sales & Business Development | 1965 |
| Dr. Paul S. Larson FAANS, M.D. | Chief Medical Officer | — |
| Ms. Mary McNamara-Cullinane RAC | Senior Vice President of Regulatory Affairs | — |
| Ms. Megan Faulkenberry | Senior Vice President of Quality | — |
Fundamentals
Valuation
Profitability
Trading
Source: third-party data provider, as of October 16, 2026
Technical indicators
- RSI 14
- 27.87
- MACD 12/26/9
- -1.23
- EMA 9 of MACD
- -0.96
- MACD histogram
- -0.27
- SMA 50
- $13.75
- Price below SMA 50
- EMA 50
- $13.15
- Price below EMA 50
- SMA 200
- $13.26
- Price below SMA 200
- EMA 200
- $13.92
- Price below EMA 200
Calculated by Gotrade from daily closing prices, as of October 14, 2026. Technical data, not a recommendation.
Analyst views
No analyst data available
Seasonality
Monthly price change (%)| Jan | Feb | Mar | Apr | May | Jun | Jul | Aug | Sep | Oct | Nov | Dec | |
|---|---|---|---|---|---|---|---|---|---|---|---|---|
| 2021 | -2.7 | -19.6 | -11.4 | |||||||||
| 2022 | -23.9 | -3.3 | +21.9 | -22.9 | +28.2 | +17.5 | +13.3 | -14.5 | -17.0 | -8.8 | -4.6 | -12.0 |
| 2023 | +14.3 | -9.8 | -7.2 | +18.7 | -23.4 | -5.9 | -3.1 | -15.9 | -12.7 | +14.6 | +1.4 | +14.1 |
| 2024 | +3.0 | -9.2 | +1.8 | -19.3 | +0.2 | -5.1 | +34.3 | +90.9 | -11.2 | +14.6 | -4.0 | +25.7 |
| 2025 | +12.4 | -14.3 | -12.3 | +9.9 | -15.1 | +1.3 | -7.6 | +4.9 | +108.9 | +11.0 | -23.9 | -0.4 |
| 2026 | -7.8 | -5.1 | -7.1 | +22.3 | +11.4 | +41.1 | -20.2 | -1.6 | -18.1 | -14.3 |