
CorMedix Inc. Common Stock (CRMD) Stock
Key stats
- Market cap
- $421.23M
- Price / Earnings ratio
- 2.2x
- EPS (TTM)
- $2.36
- Volume
- Loading
- 52-week high
- $13.02
- 52-week low
- $5.10
- EPS vs analyst estimate
- 0.0%Q3 FY25 · $0.57 vs $0.57
Source: third-party data provider, as of November 13, 2026
EPS estimate: analyst consensus
Compare with CRMD
Recent news
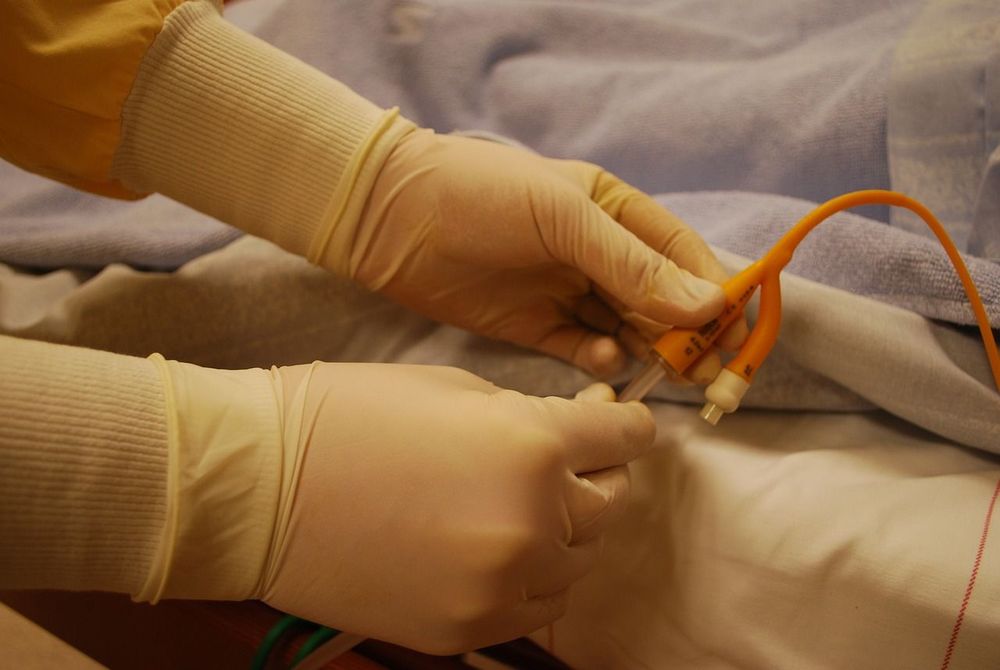
CRMD Stock Hits Fresh 52-Week Low On DaVita’s Warning Of Sharp 2027 DefenCath Reimbursement Drop
CRMD Stock Hits Fresh 52-Week Low On DaVita’s Warning Of Sharp 2027 DefenCath Reimbursement Drop
CRMD
CRMD vs. PRTA: Which Stock Should Value Investors Buy Now?
CRMD vs. PRTA: Which Stock Should Value Investors Buy Now?
CRMD
Wall Street Analysts Think CorMedix (CRMD) Could Surge 67.73%: Read This Before Placing a Bet
Wall Street Analysts Think CorMedix (CRMD) Could Surge 67.73%: Read This Before Placing a Bet
CRMD
CorMedix (CRMD) Upgraded to Buy: Here's Why
CorMedix (CRMD) Upgraded to Buy: Here's Why
CRMDNews tone: automated (AI) classification of the article's content, not a price prediction.
Technical indicators
- RSI 14
- 28.78
- MACD 12/26/9
- -0.64
- EMA 9 of MACD
- -0.47
- MACD histogram
- -0.17
- SMA 50
- $7.33
- Price below SMA 50
- EMA 50
- $7.06
- Price below EMA 50
- SMA 200
- $7.60
- Price below SMA 200
- EMA 200
- $7.88
- Price below EMA 200
Calculated by Gotrade from daily closing prices, as of November 11, 2026. Technical data, not a recommendation.
Analyst ratings
Analyst consensus: Buy
Based on 3 analyst ratings
Third-party analyst opinion, not a recommendation from Gotrade.
Financials
Performance
Debt & Balance Sheet
Revenue to Profit
2025Earnings
The market is expecting earnings per share of $0.52 for this quarter. The company has not yet shared when it is announcing earnings.
Source: third-party data provider
Latest news
CRMD Stock Hits Fresh 52-Week Low On DaVita’s Warning Of Sharp 2027 DefenCath Reimbursement Drop
CRMD Stock Hits Fresh 52-Week Low On DaVita’s Warning Of Sharp 2027 DefenCath Reimbursement Drop
CRMDCRMD vs. PRTA: Which Stock Should Value Investors Buy Now?
CRMD vs. PRTA: Which Stock Should Value Investors Buy Now?
CRMDWall Street Analysts Think CorMedix (CRMD) Could Surge 67.73%: Read This Before Placing a Bet
Wall Street Analysts Think CorMedix (CRMD) Could Surge 67.73%: Read This Before Placing a Bet
CRMDCorMedix (CRMD) Upgraded to Buy: Here's Why
CorMedix (CRMD) Upgraded to Buy: Here's Why
CRMD
Wall Street Analysts Believe CorMedix (CRMD) Could Rally 65.96%: Here's is How to Trade
Wall Street Analysts Believe CorMedix (CRMD) Could Rally 65.96%: Here's is How to Trade
CRMD
CRMD Stock Up as Q2 Earnings & Sales Beat on DefenCath, Melinta Gains
CRMD Stock Up as Q2 Earnings & Sales Beat on DefenCath, Melinta Gains
CRMD
CorMedix Q2 Earnings Call Highlights
CorMedix Q2 Earnings Call Highlights
CRMD
CorMedix CEO Expects Supplemental Filing For Fungal Disease Treatment By Q3 – CRMD Stock Sees Best Day In Nearly 10 Months After Earnings Beat
CorMedix CEO Expects Supplemental Filing For Fungal Disease Treatment By Q3 – CRMD Stock Sees Best Day In Nearly 10 Months After Earnings Beat
CRMD
CorMedix (CRMD) Q2 Earnings and Revenues Top Estimates
CorMedix (CRMD) Q2 Earnings and Revenues Top Estimates
CRMD
Is CRMD Stock a Buy Now After Strong Growth and New Risks?
Is CRMD Stock a Buy Now After Strong Growth and New Risks?
CRMDNews tone: automated (AI) classification of the article's content, not a price prediction.
About CorMedix Inc. Common Stock
A biopharmaceutical / medical-device company developing therapies based on a proprietary molecule (taurolidine) aiming to treat serious infections/inflammatory conditions.
Key Executives
| Name | Title | Year Born |
|---|---|---|
| Mr. Joseph Todisco MBA | CEO & Chairman of the Board of Directors | 1976 |
| Ms. Susan Blum | EVP & Chief Financial Officer | 1973 |
| Ms. Elizabeth Masson-Hurlburt B.A. | Executive VP and Chief Operating & Commercial Officer | 1979 |
| Ms. Kaufman Beth Zelnick Esq. | EVP, Chief Legal and Compliance Officer & Corporate Secretary | 1961 |
| Ms. Beth Steinbrenner | SVP & Chief Human Resource Officer | — |
Fundamentals
Valuation
Profitability
Trading
Source: third-party data provider, as of November 13, 2026
Technical indicators
- RSI 14
- 28.78
- MACD 12/26/9
- -0.64
- EMA 9 of MACD
- -0.47
- MACD histogram
- -0.17
- SMA 50
- $7.33
- Price below SMA 50
- EMA 50
- $7.06
- Price below EMA 50
- SMA 200
- $7.60
- Price below SMA 200
- EMA 200
- $7.88
- Price below EMA 200
Calculated by Gotrade from daily closing prices, as of November 11, 2026. Technical data, not a recommendation.
Analyst views
3 analyst ratings
Third-party analyst opinion, not a recommendation from Gotrade.
- Low
- $14.00
- Average
- $14.67
- High
- $15.00
Seasonality
Monthly price change (%)| Jan | Feb | Mar | Apr | May | Jun | Jul | Aug | Sep | Oct | Nov | Dec | |
|---|---|---|---|---|---|---|---|---|---|---|---|---|
| 2021 | -4.2 | -7.0 | ||||||||||
| 2022 | -12.8 | +15.6 | +15.1 | -38.4 | -8.2 | +34.0 | +39.7 | -35.7 | -17.7 | +9.3 | +34.2 | -1.6 |
| 2023 | +3.8 | -8.8 | -3.7 | +14.1 | -6.1 | -20.3 | +13.3 | -5.1 | -10.4 | -1.7 | -4.4 | +12.2 |
| 2024 | -21.8 | +16.4 | +15.5 | +26.1 | -4.5 | -17.4 | +7.0 | +39.9 | +38.4 | +24.2 | -1.3 | -18.2 |
| 2025 | +24.9 | +5.1 | -35.8 | +51.4 | +25.8 | -3.0 | -1.0 | +27.4 | -20.6 | +0.7 | -15.0 | +18.8 |
| 2026 | -36.2 | -12.7 | -5.8 | +8.1 | +8.3 | -7.1 | -11.1 | +9.4 | -8.1 | -23.2 | -1.7 |


















