
Canadian Solar Inc. (CSIQ) Stock
Key stats
- Market cap
- $408.74M
- Price / Earnings ratio
- -2.9x
- EPS (TTM)
- -$3.84
- Volume
- Loading
- 52-week high
- $30.05
- 52-week low
- $5.71
Source: third-party data provider, as of November 22, 2026
Compare with CSIQ
Recent news

Solar Stocks Rebound After A Brutal Rout: Is The Worst Over For ENPH, FSLR, CSIQ, SEDG Stocks?
Solar Stocks Rebound After A Brutal Rout: Is The Worst Over For ENPH, FSLR, CSIQ, SEDG Stocks?
CSIQ
New Strong Sell Stocks for October 21st
New Strong Sell Stocks for October 21st
CSIQ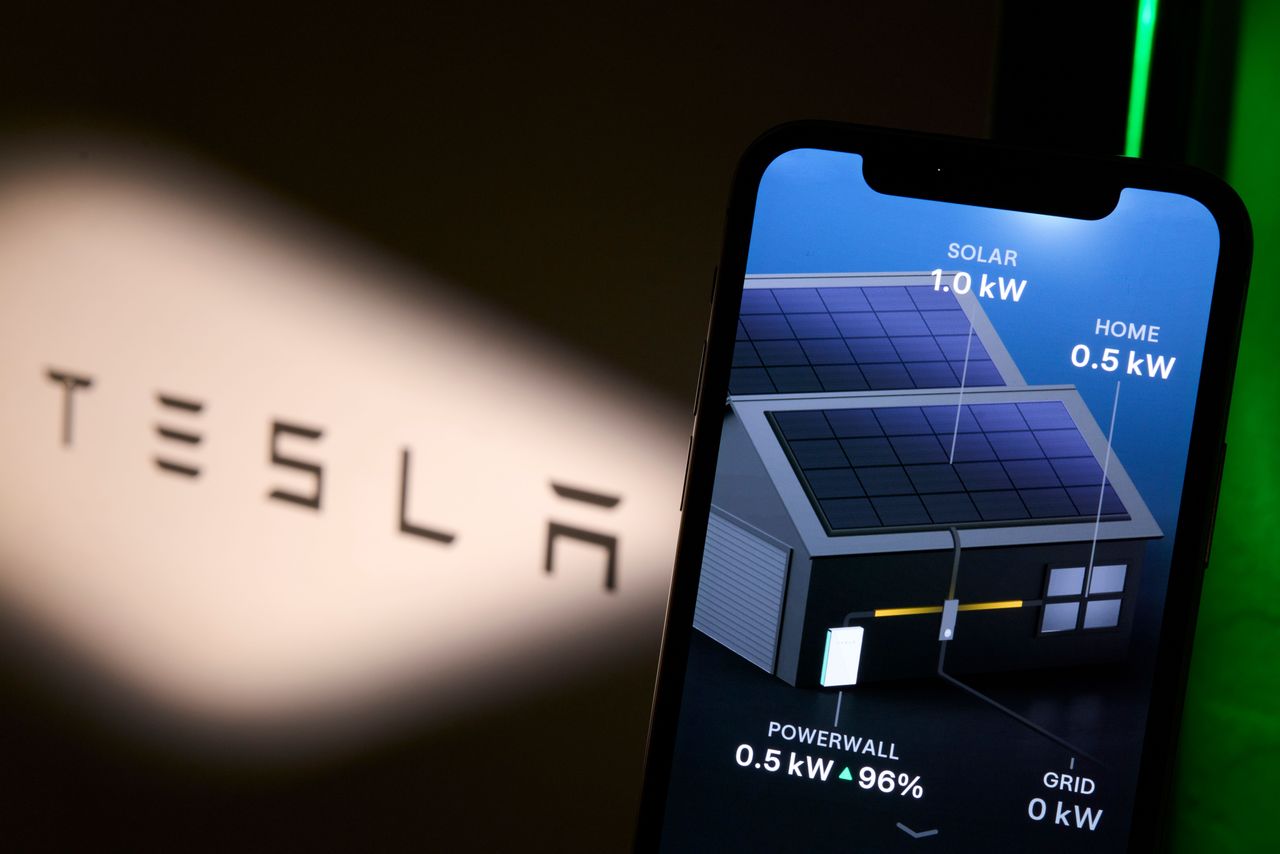
TSLA, CSIQ Stocks In Focus As China Tightens Solar Manufacturing Technology Exports
TSLA, CSIQ Stocks In Focus As China Tightens Solar Manufacturing Technology Exports
CSIQ
New Strong Sell Stocks for October 16th
New Strong Sell Stocks for October 16th
CSIQNews tone: automated (AI) classification of the article's content, not a price prediction.
Technical indicators
- RSI 14
- 24.02
- MACD 12/26/9
- -0.79
- EMA 9 of MACD
- -0.47
- MACD histogram
- -0.32
- SMA 50
- $10.35
- Price below SMA 50
- EMA 50
- $10.44
- Price below EMA 50
- SMA 200
- $14.53
- Price below SMA 200
- EMA 200
- $14.74
- Price below EMA 200
Calculated by Gotrade from daily closing prices, as of November 20, 2026. Technical data, not a recommendation.
Analyst ratings
Analyst consensus: Sell
Based on 5 analyst ratings
Third-party analyst opinion, not a recommendation from Gotrade.
Financials
Performance
Debt & Balance Sheet
Revenue to Profit
2025Earnings
Source: third-party data provider
Latest news
Solar Stocks Rebound After A Brutal Rout: Is The Worst Over For ENPH, FSLR, CSIQ, SEDG Stocks?
Solar Stocks Rebound After A Brutal Rout: Is The Worst Over For ENPH, FSLR, CSIQ, SEDG Stocks?
CSIQNew Strong Sell Stocks for October 21st
New Strong Sell Stocks for October 21st
CSIQTSLA, CSIQ Stocks In Focus As China Tightens Solar Manufacturing Technology Exports
TSLA, CSIQ Stocks In Focus As China Tightens Solar Manufacturing Technology Exports
CSIQNew Strong Sell Stocks for October 16th
New Strong Sell Stocks for October 16th
CSIQ
Canadian Solar Q2 Loss Wider Than Estimates, Revenues Fall Y/Y
Canadian Solar Q2 Loss Wider Than Estimates, Revenues Fall Y/Y
CSIQ
Canadian Solar Q2 Earnings Call Highlights
Canadian Solar Q2 Earnings Call Highlights
CSIQ
CSIQ Stock Heads For 6th Session Of Losses: Canadian Solar CEO Warns Of More Profit Pressure From US Factory Ramp-Up
CSIQ Stock Heads For 6th Session Of Losses: Canadian Solar CEO Warns Of More Profit Pressure From US Factory Ramp-Up
CSIQ
Canadian Solar (CSIQ) Reports Q2 Loss, Beats Revenue Estimates
Canadian Solar (CSIQ) Reports Q2 Loss, Beats Revenue Estimates
CSIQ
Canadian Solar Reports on August 27. Here's Why the Stock Could Climb to $19 Per Share
Canadian Solar Reports on August 27. Here's Why the Stock Could Climb to $19 Per Share
CSIQ
Canadian Solar opens US solar cell factory in Indiana
Canadian Solar opens US solar cell factory in Indiana
CSIQNews tone: automated (AI) classification of the article's content, not a price prediction.
About Canadian Solar Inc.
Canadian Solar Inc is a Canadian solar technology and renewable energy company. It is a manufacturer of solar photovoltaic modules, a provider of battery energy storage solutions, and a developer of utility-scale solar power and battery energy storage projects.. It operates through two business segments CSI Solar and Recurrent Energy segment. The CSI Solar segment focused on solar modules and battery energy storage manufacturing and products. Its Recurrent segment focused on utility-scale solar power and battery energy storage project development and operation. Key revenue is generated from CSI Solar segment.
Key Executives
| Name | Title | Year Born |
|---|---|---|
| Mr. Colin Parkin | CEO & Director | 1971 |
| Mr. Dylan Marx | CEO of Recurrent Energy | 1974 |
| Dr. Xiaohua Qu Ph.D. | Founder, Executive Chairman & CTO | 1964 |
| Mr. Xinbo Zhu | Senior VP & CFO | 1973 |
| Ms. Pauline W. Wong | Corporate Secretary & General Counsel | 1975 |
| Ms. Yu Chen | VP, Lead General Counsel & Chief Compliance Officer | 1972 |
| Ms. Hanbing Zhang | Co-Founder, VP of Global Marketing & Chief Sustainability Officer | — |
| Ms. Wina Huang | Head of Investor Relations | — |
| Mr. Ed Job CFA, M.Sc. | Managing Director of Investor Relations | — |
| Mr. Kah Locke Tham | Corporate Controller | — |
Fundamentals
Valuation
Profitability
Trading
Source: third-party data provider, as of November 22, 2026
Technical indicators
- RSI 14
- 24.02
- MACD 12/26/9
- -0.79
- EMA 9 of MACD
- -0.47
- MACD histogram
- -0.32
- SMA 50
- $10.35
- Price below SMA 50
- EMA 50
- $10.44
- Price below EMA 50
- SMA 200
- $14.53
- Price below SMA 200
- EMA 200
- $14.74
- Price below EMA 200
Calculated by Gotrade from daily closing prices, as of November 20, 2026. Technical data, not a recommendation.
Analyst views
5 analyst ratings
Third-party analyst opinion, not a recommendation from Gotrade.
- Low
- $5.58
- Average
- $12.72
- High
- $17.00
Seasonality
Monthly price change (%)| Jan | Feb | Mar | Apr | May | Jun | Jul | Aug | Sep | Oct | Nov | Dec | |
|---|---|---|---|---|---|---|---|---|---|---|---|---|
| 2021 | -6.6 | -14.7 | ||||||||||
| 2022 | -10.7 | +13.9 | +7.9 | -23.2 | +15.3 | -3.4 | +18.5 | +26.1 | -17.1 | -10.6 | +7.2 | -10.8 |
| 2023 | +38.8 | -5.4 | -4.7 | -6.3 | +13.2 | -4.4 | -5.6 | -22.1 | -13.0 | -14.1 | +8.2 | +19.9 |
| 2024 | -14.1 | -8.0 | -5.8 | -17.8 | +20.1 | -25.8 | +18.3 | -19.2 | +36.8 | -11.9 | -17.9 | -12.6 |
| 2025 | -14.4 | +3.5 | -12.0 | +3.3 | +11.4 | +9.5 | +2.7 | -13.6 | +30.5 | +39.4 | +19.2 | -13.7 |
| 2026 | -24.7 | -7.4 | -19.6 | +12.1 | +13.5 | -12.5 | -3.6 | -20.6 | -9.0 | -17.8 | -36.0 |










