
EverQuote, Inc. Class A Common Stock (EVER) Stock
Key stats
- Market cap
- $1.03B
- Price / Earnings ratio
- 8.7x
- EPS (TTM)
- $3.18
- Volume
- Loading
- 52-week high
- $31.20
- 52-week low
- $13.88
Source: third-party data provider, as of November 13, 2026
Compare with EVER
Recent news
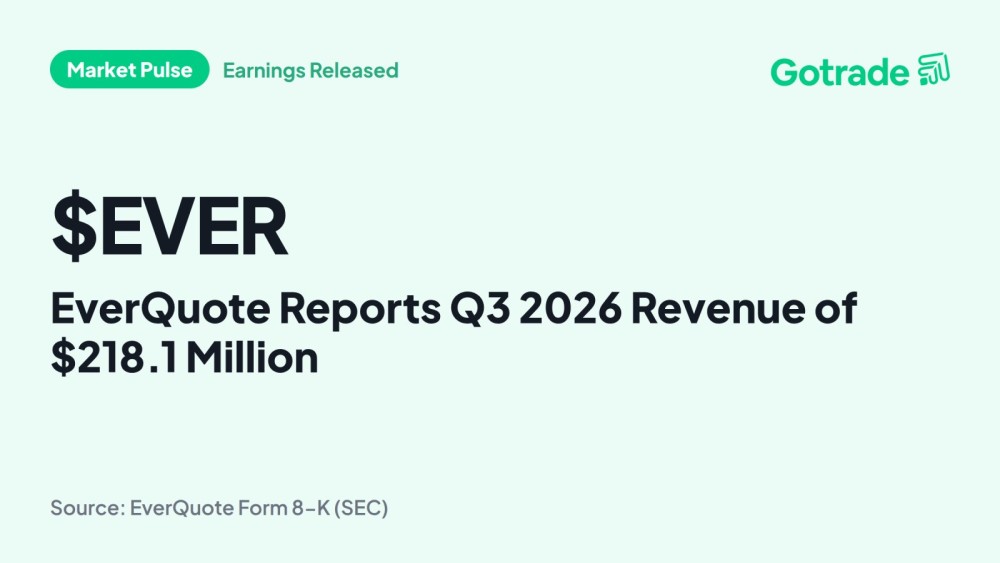
EverQuote Reports Q3 2026 Revenue of $218.1 Million
EverQuote Reports Q3 2026 Revenue of $218.1 Million
EVER
EverQuote (EVER) Reports Q3 Earnings: What Key Metrics Have to Say
EverQuote (EVER) Reports Q3 Earnings: What Key Metrics Have to Say
EVER
What EverQuote (EVER) Said on Its Q3 Earnings Call
What EverQuote (EVER) Said on Its Q3 Earnings Call
EVER
EverQuote (EVER) Q3 Earnings and Revenues Top Estimates
EverQuote (EVER) Q3 Earnings and Revenues Top Estimates
EVERNews tone: automated (AI) classification of the article's content, not a price prediction.
Technical indicators
- RSI 14
- 67.38
- MACD 12/26/9
- 2.02
- EMA 9 of MACD
- 1.51
- MACD histogram
- 0.51
- SMA 50
- $22.80
- Price above SMA 50
- EMA 50
- $23.87
- Price above EMA 50
- SMA 200
- $20.60
- Price above SMA 200
- EMA 200
- $22.04
- Price above EMA 200
Calculated by Gotrade from daily closing prices, as of November 11, 2026. Technical data, not a recommendation.
Analyst ratings
Analyst consensus: Buy
Based on 4 analyst ratings
Third-party analyst opinion, not a recommendation from Gotrade.
Financials
Performance
Debt & Balance Sheet
Revenue to Profit
2025Earnings
No data available
Source: third-party data provider
Latest news
EverQuote Reports Q3 2026 Revenue of $218.1 Million
EverQuote Reports Q3 2026 Revenue of $218.1 Million
EVEREverQuote (EVER) Reports Q3 Earnings: What Key Metrics Have to Say
EverQuote (EVER) Reports Q3 Earnings: What Key Metrics Have to Say
EVERWhat EverQuote (EVER) Said on Its Q3 Earnings Call
What EverQuote (EVER) Said on Its Q3 Earnings Call
EVEREverQuote (EVER) Q3 Earnings and Revenues Top Estimates
EverQuote (EVER) Q3 Earnings and Revenues Top Estimates
EVER
Why Is EverQuote (EVER) Up 4.1% Since Last Earnings Report?
Why Is EverQuote (EVER) Up 4.1% Since Last Earnings Report?
EVER
EverQuote Eyes $1B Revenue as Insurers Shift From Profit to Growth
EverQuote Eyes $1B Revenue as Insurers Shift From Profit to Growth
EVER
EVER Enhances AI-Powered P&C Insurance Solutions With Waniwani
EVER Enhances AI-Powered P&C Insurance Solutions With Waniwani
EVER
EVER Q2 Beat Earnings Estimates on Auto, Home Insurance Growth
EVER Q2 Beat Earnings Estimates on Auto, Home Insurance Growth
EVER
EverQuote (EVER) Q2 Earnings and Revenues Top Estimates
EverQuote (EVER) Q2 Earnings and Revenues Top Estimates
EVER
EverQuote (EVER) Reports Q2 Earnings: What Key Metrics Have to Say
EverQuote (EVER) Reports Q2 Earnings: What Key Metrics Have to Say
EVERNews tone: automated (AI) classification of the article's content, not a price prediction.
About EverQuote, Inc. Class A Common Stock
EverQuote Inc is engaged in the business activity of offering an online marketplace for insurance shopping, connecting consumers with insurance provider customers, which includes both carriers and agents. The online marketplace offers consumers to find relevant insurance quotes based on car insurance, home insurance, and life insurance. The platform of the company is driven by data science. The firm's data and technology platform match and connects consumers seeking to purchase insurance with relevant options from its broad direct network of insurance providers. It derives a majority of revenue from Direct channels.
Key Executives
| Name | Title | Year Born |
|---|---|---|
| Mr. Jayme Mendal | President, CEO & Director | 1986 |
| Mr. David Bransford Blundin | Co-Founder & Chairman | 1967 |
| Mr. Joseph Sanborn | CFO, Chief Administrative Officer, Treasurer & Secretary | 1970 |
| Mr. Jon Ayotte | Chief Accounting Officer | 1985 |
| Mr. David Brainard | Chief Technology Officer | 1973 |
| Mr. Eugene Suzuki | Chief Information Officer | 1975 |
| Mr. Tom Ellis | Executive Vice President of Growth Strategy | — |
| Mr. Hunter Ingram | Chief Commercial Officer | — |
| Mr. Jesse Wolf | Chief Product Officer | — |
| Mr. Eric Terada | Chief Growth Officer | — |
Fundamentals
Valuation
Profitability
Trading
Source: third-party data provider, as of November 13, 2026
Technical indicators
- RSI 14
- 67.38
- MACD 12/26/9
- 2.02
- EMA 9 of MACD
- 1.51
- MACD histogram
- 0.51
- SMA 50
- $22.80
- Price above SMA 50
- EMA 50
- $23.87
- Price above EMA 50
- SMA 200
- $20.60
- Price above SMA 200
- EMA 200
- $22.04
- Price above EMA 200
Calculated by Gotrade from daily closing prices, as of November 11, 2026. Technical data, not a recommendation.
Analyst views
4 analyst ratings
Third-party analyst opinion, not a recommendation from Gotrade.
- Low
- $30.00
- Average
- $33.00
- High
- $35.00
Seasonality
Monthly price change (%)| Jan | Feb | Mar | Apr | May | Jun | Jul | Aug | Sep | Oct | Nov | Dec | |
|---|---|---|---|---|---|---|---|---|---|---|---|---|
| 2026 | -0.1 | -29.8 | -3.5 | -2.2 | +32.8 | +19.2 | +2.0 | +5.6 | -19.2 | +17.7 | +19.3 |










