
iShares MSCI Japan ETF (EWJ) Stock
Key stats
- Market cap
- $10.02B
- Volume
- Loading
- 52-week high
- $99.98
- 52-week low
- $79.48
Source: third-party data provider, as of November 13, 2026
Recent news

US Vs Asia Stocks: China Outpaces Peers As Support Measures Stabilize Markets Amid Midterms-Led Tech Selloff
US Vs Asia Stocks: China Outpaces Peers As Support Measures Stabilize Markets Amid Midterms-Led Tech Selloff
EWJ
BOJ locks in December hike, but neutral-rate uncertainty muddies outlook
BOJ locks in December hike, but neutral-rate uncertainty muddies outlook
EWJ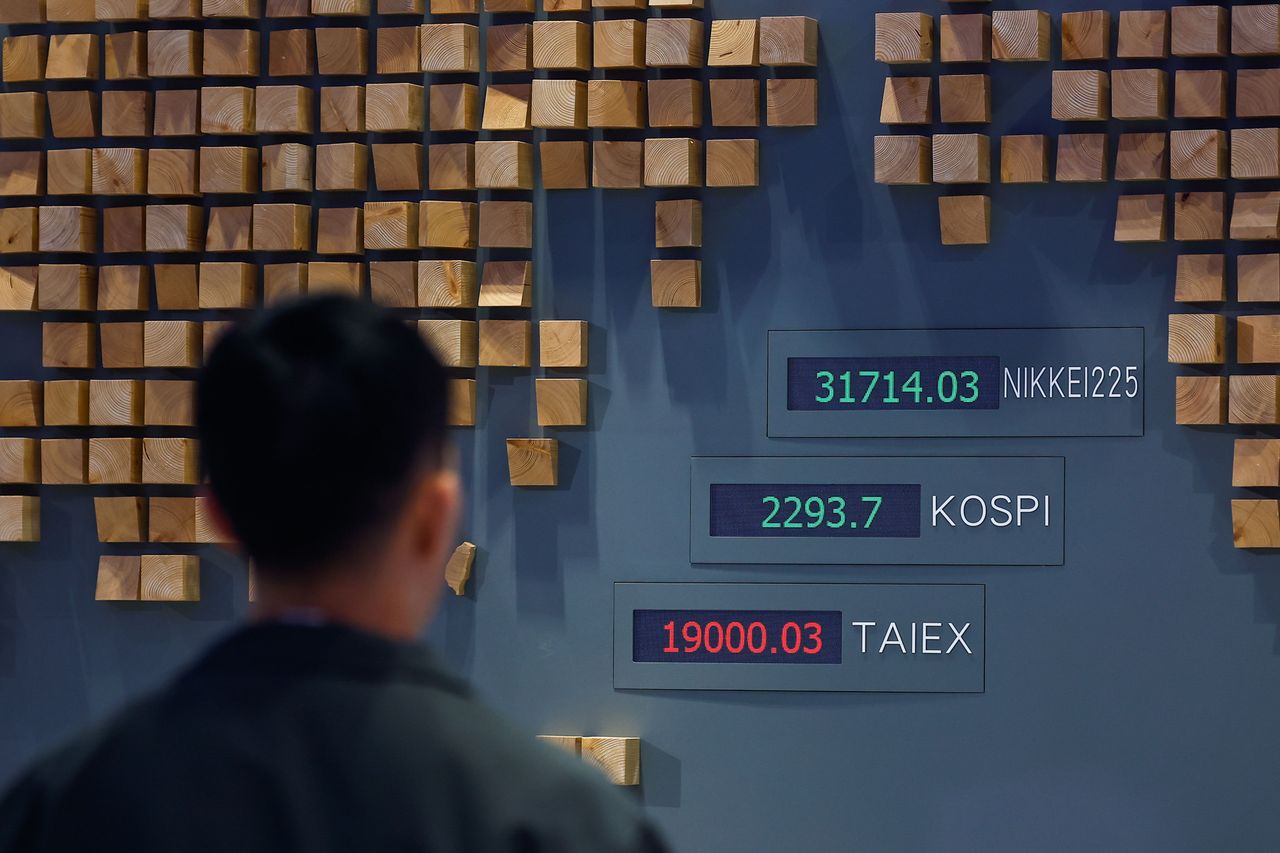
Stocktwits Passport Portfolio: SPY, DIA Edge Higher In October, Beating QQQ And Asian Stocks Amid Tech Volatility
Stocktwits Passport Portfolio: SPY, DIA Edge Higher In October, Beating QQQ And Asian Stocks Amid Tech Volatility
EWJ
BOJ holds rates as inflation aligns with 2% target for first time since 2013
BOJ holds rates as inflation aligns with 2% target for first time since 2013
EWJNews tone: automated (AI) classification of the article's content, not a price prediction.
Technical indicators
- RSI 14
- 44.79
- MACD 12/26/9
- -1.53
- EMA 9 of MACD
- -1.31
- MACD histogram
- -0.23
- SMA 50
- $95.86
- Price below SMA 50
- EMA 50
- $94.57
- Price below EMA 50
- SMA 200
- $92.04
- Price above SMA 200
- EMA 200
- $91.45
- Price above EMA 200
Calculated by Gotrade from daily closing prices, as of November 11, 2026. Technical data, not a recommendation.
Analyst ratings
No analyst data available
Financials
Performance
No data available
Debt & Balance Sheet
No data available
Revenue to Profit
No data available
Earnings
No data available
Source: third-party data provider
Latest news
US Vs Asia Stocks: China Outpaces Peers As Support Measures Stabilize Markets Amid Midterms-Led Tech Selloff
US Vs Asia Stocks: China Outpaces Peers As Support Measures Stabilize Markets Amid Midterms-Led Tech Selloff
EWJBOJ locks in December hike, but neutral-rate uncertainty muddies outlook
BOJ locks in December hike, but neutral-rate uncertainty muddies outlook
EWJStocktwits Passport Portfolio: SPY, DIA Edge Higher In October, Beating QQQ And Asian Stocks Amid Tech Volatility
Stocktwits Passport Portfolio: SPY, DIA Edge Higher In October, Beating QQQ And Asian Stocks Amid Tech Volatility
EWJBOJ holds rates as inflation aligns with 2% target for first time since 2013
BOJ holds rates as inflation aligns with 2% target for first time since 2013
EWJ
Japan Inflation Accelerates: ETFs to Watch Amid Rate Uncertainty
Japan Inflation Accelerates: ETFs to Watch Amid Rate Uncertainty
EWJ
BOJ's next rate hike likely in December or January, CNBC Survey shows
BOJ's next rate hike likely in December or January, CNBC Survey shows
EWJ
Bank of Japan is expected to hold rates this week — but stay hawkish: CNBC survey
Bank of Japan is expected to hold rates this week — but stay hawkish: CNBC survey
EWJ
Japan companies compensate users as cyberattacks buffet economy
Japan companies compensate users as cyberattacks buffet economy
EWJ
Japan core inflation in September surges to its highest this year at 2.1%
Japan core inflation in September surges to its highest this year at 2.1%
EWJ
Japan exports post huge miss in September as growth slows to 16.7%
Japan exports post huge miss in September as growth slows to 16.7%
EWJNews tone: automated (AI) classification of the article's content, not a price prediction.
About iShares MSCI Japan ETF
The iShares MSCI Japan ETF seeks to track the investment results of an index composed of Japanese equities. The fund seeks exposure to large and mid-sized companies in Japan.
Fundamentals
Trading
Dividend
Source: third-party data provider, as of November 13, 2026
Technical indicators
- RSI 14
- 44.79
- MACD 12/26/9
- -1.53
- EMA 9 of MACD
- -1.31
- MACD histogram
- -0.23
- SMA 50
- $95.86
- Price below SMA 50
- EMA 50
- $94.57
- Price below EMA 50
- SMA 200
- $92.04
- Price above SMA 200
- EMA 200
- $91.45
- Price above EMA 200
Calculated by Gotrade from daily closing prices, as of November 11, 2026. Technical data, not a recommendation.
Analyst views
No analyst data available
Seasonality
Monthly price change (%)| Jan | Feb | Mar | Apr | May | Jun | Jul | Aug | Sep | Oct | Nov | Dec | |
|---|---|---|---|---|---|---|---|---|---|---|---|---|
| 2021 | -5.3 | +1.5 | ||||||||||
| 2022 | -4.4 | -1.8 | -0.8 | -8.6 | +1.8 | -8.3 | +5.8 | -5.8 | -7.7 | +0.5 | +10.8 | -3.1 |
| 2023 | +7.3 | -5.0 | +4.7 | -0.2 | +1.0 | +1.8 | +2.1 | -1.6 | -2.8 | -1.4 | +4.4 | +1.5 |
| 2024 | +4.2 | +3.3 | +1.5 | -4.3 | +2.8 | -1.7 | +4.7 | +6.5 | +0.9 | -5.0 | +2.5 | -4.9 |
| 2025 | +1.9 | +1.2 | -0.9 | +4.7 | +4.1 | -0.1 | -1.1 | +5.7 | +2.6 | +4.0 | -0.8 | -2.2 |
| 2026 | +5.4 | +7.5 | -6.4 | +3.0 | +5.3 | +0.4 | -0.7 | +3.2 | +2.4 | -4.6 | -0.8 |
Corporate actions
Upcoming
No upcoming corporate actions for EWJ










