
iShares MSCI Taiwan ETF (EWT) Stock
Key stats
- Market cap
- $4.13B
- Volume
- Loading
- 52-week high
- $118.47
- 52-week low
- $59.96
Source: third-party data provider, as of November 13, 2026
Recent news

US Vs Asia Stocks: China Outpaces Peers As Support Measures Stabilize Markets Amid Midterms-Led Tech Selloff
US Vs Asia Stocks: China Outpaces Peers As Support Measures Stabilize Markets Amid Midterms-Led Tech Selloff
EWT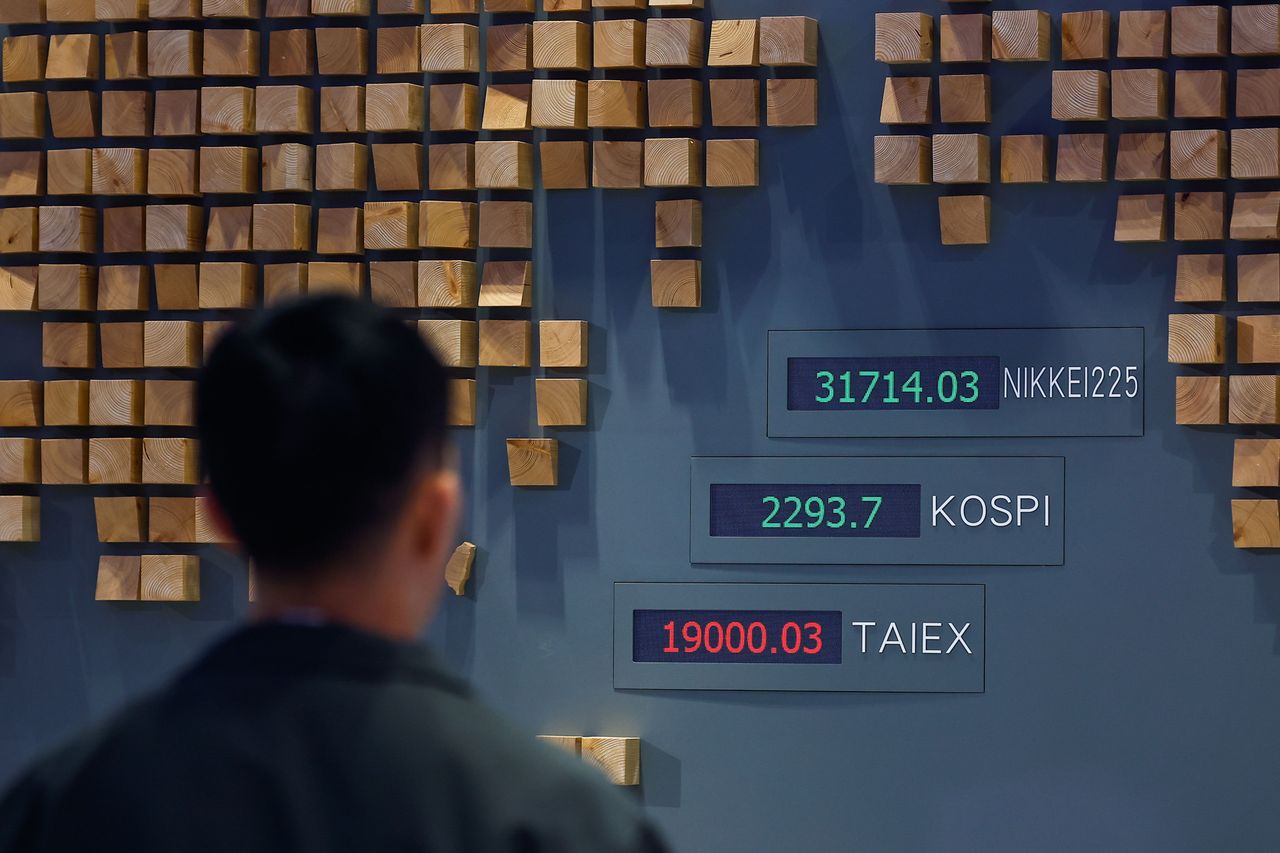
Stocktwits Passport Portfolio: SPY, DIA Edge Higher In October, Beating QQQ And Asian Stocks Amid Tech Volatility
Stocktwits Passport Portfolio: SPY, DIA Edge Higher In October, Beating QQQ And Asian Stocks Amid Tech Volatility
EWT
Korea's Stock Market Is in Free Fall, and Hot U.S. Inflation Just Made It Worse
Korea's Stock Market Is in Free Fall, and Hot U.S. Inflation Just Made It Worse
EWTStocktwits Passport Portfolio: Wall Street Outpaces Asia As AI Trade Wobbles And Bond Yields Climb
Stocktwits Passport Portfolio: Wall Street Outpaces Asia As AI Trade Wobbles And Bond Yields Climb
EWTNews tone: automated (AI) classification of the article's content, not a price prediction.
Technical indicators
- RSI 14
- 46.67
- MACD 12/26/9
- -4.20
- EMA 9 of MACD
- -3.68
- MACD histogram
- -0.52
- SMA 50
- $108.35
- Price below SMA 50
- EMA 50
- $104.89
- Price below EMA 50
- SMA 200
- $94.40
- Price above SMA 200
- EMA 200
- $93.02
- Price above EMA 200
Calculated by Gotrade from daily closing prices, as of November 11, 2026. Technical data, not a recommendation.
Analyst ratings
No analyst data available
Financials
Performance
No data available
Debt & Balance Sheet
No data available
Revenue to Profit
No data available
Earnings
No data available
Source: third-party data provider
Latest news
US Vs Asia Stocks: China Outpaces Peers As Support Measures Stabilize Markets Amid Midterms-Led Tech Selloff
US Vs Asia Stocks: China Outpaces Peers As Support Measures Stabilize Markets Amid Midterms-Led Tech Selloff
EWTStocktwits Passport Portfolio: SPY, DIA Edge Higher In October, Beating QQQ And Asian Stocks Amid Tech Volatility
Stocktwits Passport Portfolio: SPY, DIA Edge Higher In October, Beating QQQ And Asian Stocks Amid Tech Volatility
EWTKorea's Stock Market Is in Free Fall, and Hot U.S. Inflation Just Made It Worse
Korea's Stock Market Is in Free Fall, and Hot U.S. Inflation Just Made It Worse
EWTStocktwits Passport Portfolio: Wall Street Outpaces Asia As AI Trade Wobbles And Bond Yields Climb
Stocktwits Passport Portfolio: Wall Street Outpaces Asia As AI Trade Wobbles And Bond Yields Climb
EWT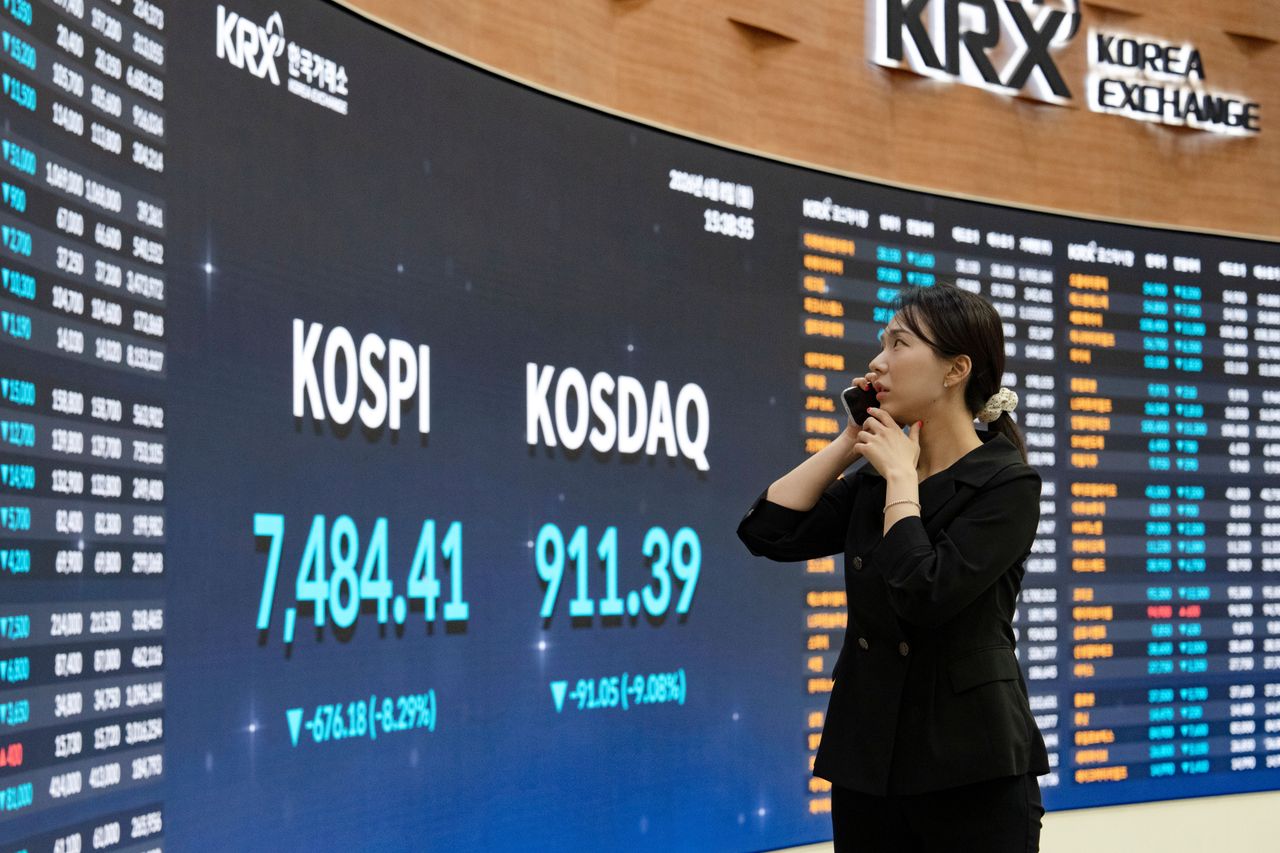
International Markets Are Pulling Ahead Of US Stocks In 2026: These 4 ETFs Have Left SPY, QQQ, DIA In The Dust
International Markets Are Pulling Ahead Of US Stocks In 2026: These 4 ETFs Have Left SPY, QQQ, DIA In The Dust
EWT
Stocktwits Passport Portfolio: QQQ Holds Up Better Than SPY, DIA And Asian Stocks Amid Bond Market Rout This Week
Stocktwits Passport Portfolio: QQQ Holds Up Better Than SPY, DIA And Asian Stocks Amid Bond Market Rout This Week
EWT
India vs. China ETFs: A Tale of Two Emerging Markets in 2026
India vs. China ETFs: A Tale of Two Emerging Markets in 2026
EWT
Taiwan says it is in continuous talks with US about arms sales
Taiwan says it is in continuous talks with US about arms sales
EWT
Beyond 60/40: ETFs for a Balanced Retirement Portfolio
Beyond 60/40: ETFs for a Balanced Retirement Portfolio
EWT
Stocktwits Passport Portfolio: QQQ Weekly Rally Leaves SPY, DIA And Asia In The Dust
Stocktwits Passport Portfolio: QQQ Weekly Rally Leaves SPY, DIA And Asia In The Dust
EWTNews tone: automated (AI) classification of the article's content, not a price prediction.
About iShares MSCI Taiwan ETF
The iShares MSCI Taiwan ETF seeks to track the investment results of an index composed of Taiwanese equities, as represented by the MSCI Taiwan 25/50 Index. The Fund invests in a representative sample of securities included in the Index that collectively has an investment profile similar to the Index. Due to the use of representative sampling, the Fund may or may not hold all of the securities that are included in the Index.
Fundamentals
Trading
Dividend
Source: third-party data provider, as of November 13, 2026
Technical indicators
- RSI 14
- 46.67
- MACD 12/26/9
- -4.20
- EMA 9 of MACD
- -3.68
- MACD histogram
- -0.52
- SMA 50
- $108.35
- Price below SMA 50
- EMA 50
- $104.89
- Price below EMA 50
- SMA 200
- $94.40
- Price above SMA 200
- EMA 200
- $93.02
- Price above EMA 200
Calculated by Gotrade from daily closing prices, as of November 11, 2026. Technical data, not a recommendation.
Analyst views
No analyst data available
Seasonality
Monthly price change (%)| Jan | Feb | Mar | Apr | May | Jun | Jul | Aug | Sep | Oct | Nov | Dec | |
|---|---|---|---|---|---|---|---|---|---|---|---|---|
| 2021 | -1.2 | +1.9 | ||||||||||
| 2022 | -3.4 | -1.9 | -3.4 | -9.1 | +2.5 | -10.9 | +4.5 | -0.2 | -12.8 | -4.4 | +20.7 | -20.9 |
| 2023 | +11.0 | -4.5 | +2.5 | -3.7 | +5.7 | +0.8 | +0.7 | -4.4 | -2.6 | -2.4 | +10.6 | -6.1 |
| 2024 | -0.7 | +3.0 | +3.9 | -3.4 | +7.3 | +6.6 | -1.7 | +4.0 | +4.3 | +1.3 | -3.0 | -4.5 |
| 2025 | +0.2 | -0.4 | -5.5 | -1.5 | +9.5 | +8.6 | +1.4 | +0.7 | +9.6 | +3.9 | -3.6 | -0.9 |
| 2026 | +5.1 | +9.8 | -5.5 | +25.3 | +14.2 | +2.1 | -8.6 | +10.3 | +2.9 | -10.3 | -0.5 |
Corporate actions
Upcoming
No upcoming corporate actions for EWT










