
4D Molecular Therapeutics, Inc. Common Stock (FDMT) Stock
NASDAQ · FDMT
Fundamentals
Market cap
$701.60M
Price / Earnings ratio
-3.9x
Price / Sales ratio
7.6x
Price / Book ratio
1.7x
Return on assets
-36.0%
Dividend amount
$0.00
Dividend yield
0.00%
Source: third-party data provider, as of October 9, 2026
Compare with FDMT
Recent news

Stocktwits
OCUL Stock On Track For Worst Week In 2.5 Years As Rivals Raise The Bar In Wet AMD
FDMTOctober 1, 2026
Stocktwits
OCUL Stock On Track For Worst Week In 2.5 Years As Rivals Raise The Bar In Wet AMD
FDMTStocktwits
OCUL Stock Suffers Sharpest Drop Since February As KOD And FDMT Post Updates On Their Wet AMD Drugs
FDMTSeptember 28, 2026
Stocktwits
OCUL Stock Suffers Sharpest Drop Since February As KOD And FDMT Post Updates On Their Wet AMD Drugs
FDMT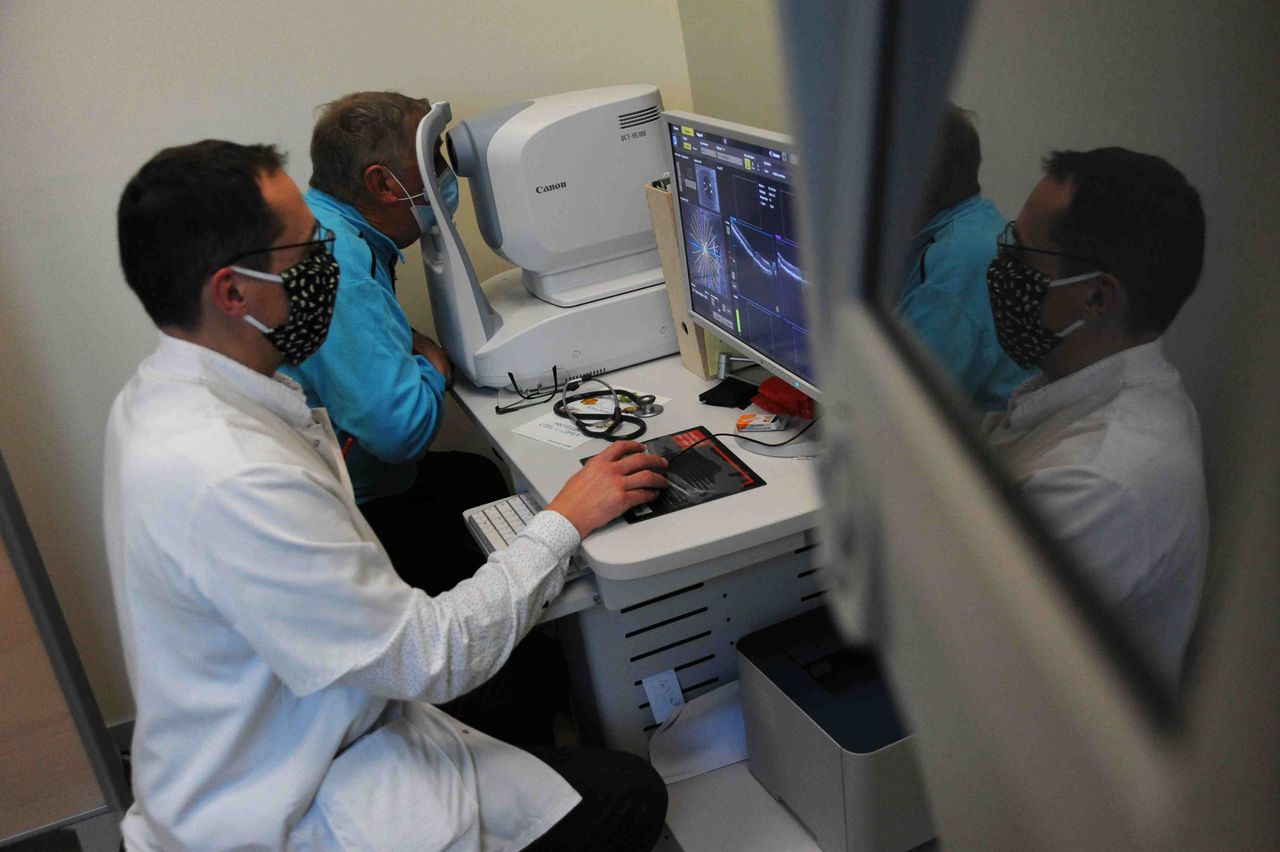
Stocktwits
OCUL, FDMT Stock Clock Best Day In Weeks After EyePoint’s Trial Setback — Here’s Why
FDMTAugust 17, 2026
Stocktwits
OCUL, FDMT Stock Clock Best Day In Weeks After EyePoint’s Trial Setback — Here’s Why
FDMT
Zacks Investment Research
4D Molecular Therapeutics, Inc. (FDMT) Reports Q2 Loss, Tops Revenue Estimates
FDMTAugust 13, 2026
Zacks Investment Research
4D Molecular Therapeutics, Inc. (FDMT) Reports Q2 Loss, Tops Revenue Estimates
FDMTTechnical indicators
- RSI 14
- 37.68
- MACD 12/26/9
- -0.29
- EMA 9 of MACD
- 0.00
- MACD histogram
- -0.30
- SMA 50
- $13.62
- Price below SMA 50
- EMA 50
- $13.47
- Price below EMA 50
- SMA 200
- $10.51
- Price above SMA 200
- EMA 200
- $11.32
- Price above EMA 200
Calculated by Gotrade from daily closing prices, as of October 8, 2026. Technical data, not a recommendation.
Analyst ratings
Analyst consensus: Buy
Based on 5 analysts
Strong Sell0
Sell0
Hold0
Buy5
Strong Buy0
Third-party analyst opinion, not a recommendation from Gotrade.
Financials
Performance
Revenue
Net income
Net margin %
2025
102M67M34M0
Debt & Balance Sheet
Total assets
Total liabilities
2025
680M449M224M0
Revenue to Profit
2025$85.2M
Revenue$0.0
Cost of revenue$0.0
Gross profit$0.0
Operating expenses$-140.1M
Net incomeEarnings
No data available
Source: third-party data provider
Latest news
Stocktwits
OCUL Stock On Track For Worst Week In 2.5 Years As Rivals Raise The Bar In Wet AMD
FDMTOctober 1, 2026
Stocktwits
OCUL Stock On Track For Worst Week In 2.5 Years As Rivals Raise The Bar In Wet AMD
FDMTStocktwits
OCUL Stock Suffers Sharpest Drop Since February As KOD And FDMT Post Updates On Their Wet AMD Drugs
FDMTSeptember 28, 2026
Stocktwits
OCUL Stock Suffers Sharpest Drop Since February As KOD And FDMT Post Updates On Their Wet AMD Drugs
FDMTStocktwits
OCUL, FDMT Stock Clock Best Day In Weeks After EyePoint’s Trial Setback — Here’s Why
FDMTAugust 17, 2026
Stocktwits
OCUL, FDMT Stock Clock Best Day In Weeks After EyePoint’s Trial Setback — Here’s Why
FDMTZacks Investment Research
4D Molecular Therapeutics, Inc. (FDMT) Reports Q2 Loss, Tops Revenue Estimates
FDMTAugust 13, 2026
Zacks Investment Research
4D Molecular Therapeutics, Inc. (FDMT) Reports Q2 Loss, Tops Revenue Estimates
FDMT
Zacks Investment Research
Strength Seen in 4D Molecular Therapeutics (FDMT): Can Its 7.9% Jump Turn into More Strength?
FDMTJune 23, 2026
Zacks Investment Research
Strength Seen in 4D Molecular Therapeutics (FDMT): Can Its 7.9% Jump Turn into More Strength?
FDMT
MarketBeat
4D Molecular Therapeutics Touts Rapid Phase 3 Momentum for Retinal Gene Therapy
FDMTMay 17, 2026
MarketBeat
4D Molecular Therapeutics Touts Rapid Phase 3 Momentum for Retinal Gene Therapy
FDMT
Zacks Investment Research
4D Molecular Therapeutics, Inc. (FDMT) Reports Q1 Loss, Lags Revenue Estimates
FDMTMay 8, 2026
Zacks Investment Research
4D Molecular Therapeutics, Inc. (FDMT) Reports Q1 Loss, Lags Revenue Estimates
FDMT
Zacks Investment Research
4D Molecular Therapeutics, Inc. (FDMT) Q4 Earnings and Revenues Beat Estimates
FDMTMarch 18, 2026
Zacks Investment Research
4D Molecular Therapeutics, Inc. (FDMT) Q4 Earnings and Revenues Beat Estimates
FDMT
Benzinga
6 Underperforming IPO Stocks To Buy On The Dip
FDMTFebruary 4, 2022
Benzinga
6 Underperforming IPO Stocks To Buy On The Dip
FDMTAbout 4D Molecular Therapeutics, Inc. Common Stock
No description available.
SectorHealthcare
IndustryBiotechnology
Employees196
CEODr. David H. Kirn M.D.
IPO DateDec 11, 2020
HeadquartersEmeryVille, CA
Key Executives
| Name | Title | Year Born |
|---|---|---|
| Dr. John F. Milligan Ph.D. | Executive Chairman | 1961 |
| Dr. David H. Kirn M.D. | Co-Founder, President, CEO & Director | 1962 |
| Mr. Kristian Humer M.B.A. | CFO and Principal Financial & Accounting Officer | 1976 |
| Dr. Fariborz Kamal Ph.D. | Chief Technical Advisor | 1963 |
| Ms. Theresa Janke | Co-Founder & Chief of Staff | 1975 |
| Julian Pei | Head of Investor Relations & Corporate Finance | — |
| Dr. Katy Barglow Ph.D. | Chief Technical Officer | — |
| Dr. Scott P. Bizily J.D., Ph.D. | Chief Legal Officer & Corporate Secretary | 1972 |
| Dr. An Song Ph.D. | Chief Translational Medicine Advisor | — |
| Dr. Noriyuki Kasahara M.D., Ph.D. | Chief Scientific Advisor | 1963 |
Fundamentals
Valuation
Market cap$701.60M
Price-to-sales ratio7.56
Price-to-book value1.71
Price-earnings ratio-3.90
Return on Equity-41.00%
Return on Sales-195.00%
Return on Assets-36.00%
Earnings Per Share
Earnings Per Share$-2.63
Income Statement
Average volume1,026,654
EBITDA$-171.05M
1 year high (52w)$16.93
1 year low (52w)$6.96
Dividend
Dividend amount$0.00
Dividend yield0.00%
Source: third-party data provider, as of October 9, 2026
Technical indicators
- RSI 14
- 37.68
- MACD 12/26/9
- -0.29
- EMA 9 of MACD
- 0.00
- MACD histogram
- -0.30
- SMA 50
- $13.62
- Price below SMA 50
- EMA 50
- $13.47
- Price below EMA 50
- SMA 200
- $10.51
- Price above SMA 200
- EMA 200
- $11.32
- Price above EMA 200
Calculated by Gotrade from daily closing prices, as of October 8, 2026. Technical data, not a recommendation.
Analyst views
5 analyst ratings
Third-party analyst opinion, not a recommendation from Gotrade.
Analyst consensus:Buy
100% Buy
0% Hold
0% Sell
Analyst price target
- Low
- $20.00
- Average
- $30.20
- High
- $37.00
Seasonality
Monthly price change (%)| Jan | Feb | Mar | Apr | May | Jun | Jul | Aug | Sep | Oct | Nov | Dec | |
|---|---|---|---|---|---|---|---|---|---|---|---|---|
| 2021 | -7.6 | -4.6 | -3.2 | |||||||||
| 2022 | -30.2 | -13.2 | +11.0 | -22.5 | -39.7 | -8.2 | +35.1 | -12.8 | +0.0 | +10.9 | +170.4 | -3.7 |
| 2023 | +2.0 | -10.4 | -6.4 | +4.0 | -2.1 | -0.1 | +2.5 | -12.0 | -23.1 | -9.1 | +19.1 | +52.6 |
| 2024 | -18.8 | +50.1 | +8.5 | -20.3 | -5.6 | -15.1 | -16.9 | -12.7 | -26.7 | -23.1 | -3.2 | -26.6 |
| 2025 | -3.9 | -23.6 | -22.0 | +12.7 | +5.2 | -1.1 | +8.4 | -4.0 | +41.5 | +31.7 | +3.9 | -28.6 |
| 2026 | +21.0 | +5.6 | -0.2 | -10.1 | +9.0 | +37.0 | -19.8 | +39.8 | -0.3 | -8.2 |
Compare stocks
Market cap
$701.60M
-
-
-
Price / Earnings ratio
-3.90
-
-
-
Price / Sales ratio
7.56
-
-
-
Dividend yield
0.00%
-
-
-
Average volume
1,026,654
-
-
-
Earnings per share
$-2.63
-
-
-


















