Flex (FLEX) Stock
Key stats
- Market cap
- $28.11B
- Price / Earnings ratio
- 27.9x
- EPS (TTM)
- $2.82
- Volume
- Loading
- 52-week high
- $166.86
- 52-week low
- $53.07
- EPS vs analyst estimate
- +9.7%Q2 FY26 · $0.79 vs $0.72
Source: third-party data provider, as of November 11, 2026
EPS estimate: analyst consensus
Compare with FLEX
Recent news
Flex Says Axiom Spin-Off on Track for Calendar Q1 2027
Flex Says Axiom Spin-Off on Track for Calendar Q1 2027
FLEX
FLEX or TER: Which Is the Better Value Stock Right Now?
FLEX or TER: Which Is the Better Value Stock Right Now?
FLEX
Flex's CPI Sales Surge 54%: Can AI Infrastructure Sustain Gains?
Flex's CPI Sales Surge 54%: Can AI Infrastructure Sustain Gains?
FLEX
Are Computer and Technology Stocks Lagging Flex (FLEX) This Year?
Are Computer and Technology Stocks Lagging Flex (FLEX) This Year?
FLEXNews tone: automated (AI) classification of the article's content, not a price prediction.
Technical indicators
- RSI 14
- 39.40
- MACD 12/26/9
- -8.12
- EMA 9 of MACD
- -7.75
- MACD histogram
- -0.37
- SMA 50
- $101.03
- Price below SMA 50
- EMA 50
- $97.50
- Price below EMA 50
- SMA 200
- $103.55
- Price below SMA 200
- EMA 200
- $95.96
- Price below EMA 200
Calculated by Gotrade from daily closing prices, as of November 10, 2026. Technical data, not a recommendation.
Analyst ratings
Analyst consensus: Buy
Based on 3 analyst ratings
Third-party analyst opinion, not a recommendation from Gotrade.
Financials
Performance
Debt & Balance Sheet
Revenue to Profit
2026Earnings
The market is expecting earnings per share of $0.78 for this quarter. The company has not yet shared when it is announcing earnings.
Source: third-party data provider
Latest news
Flex Says Axiom Spin-Off on Track for Calendar Q1 2027
Flex Says Axiom Spin-Off on Track for Calendar Q1 2027
FLEXFLEX or TER: Which Is the Better Value Stock Right Now?
FLEX or TER: Which Is the Better Value Stock Right Now?
FLEXFlex's CPI Sales Surge 54%: Can AI Infrastructure Sustain Gains?
Flex's CPI Sales Surge 54%: Can AI Infrastructure Sustain Gains?
FLEXAre Computer and Technology Stocks Lagging Flex (FLEX) This Year?
Are Computer and Technology Stocks Lagging Flex (FLEX) This Year?
FLEX
Can FLEX's EPC Power Deal Deepen Its AI Data Center Growth Advantage?
Can FLEX's EPC Power Deal Deepen Its AI Data Center Growth Advantage?
FLEX
Is FLEX a Buy Now as AI Growth Collides With Higher Spending Risks?
Is FLEX a Buy Now as AI Growth Collides With Higher Spending Risks?
FLEX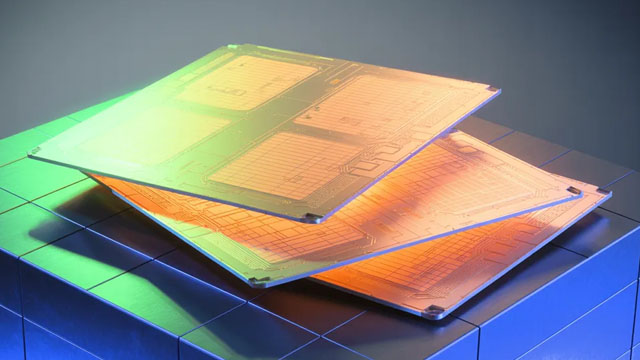
FLEX Jumps 13% in One Week as AI Growth Tests Rally Staying Power
FLEX Jumps 13% in One Week as AI Growth Tests Rally Staying Power
FLEX
Flex Stock Down Post Q2 Earnings: Should You Buy, Hold or Offload?
Flex Stock Down Post Q2 Earnings: Should You Buy, Hold or Offload?
FLEX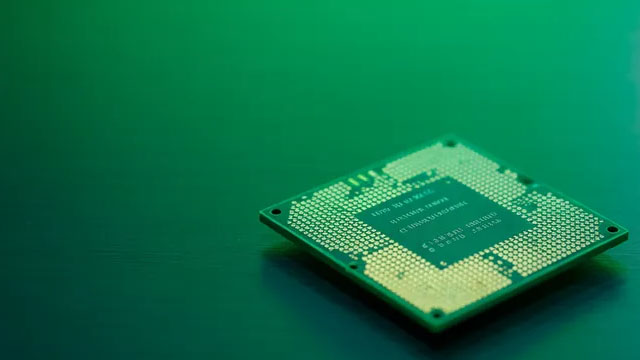
Flex (FLEX) Q2 Earnings: Taking a Look at Key Metrics Versus Estimates
Flex (FLEX) Q2 Earnings: Taking a Look at Key Metrics Versus Estimates
FLEX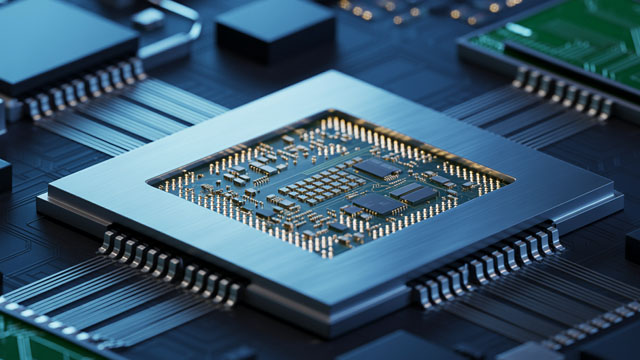
Flex Q2 Earnings Call Highlights
Flex Q2 Earnings Call Highlights
FLEXNews tone: automated (AI) classification of the article's content, not a price prediction.
About Flex
Flex is a global supply chain & manufacturing solutions provider. We help design, build, & deliver products to make the world a better place. Flex has built a company-wide culture around collaboration and execution, led by some of the industry’s most innovative minds. Every hour of every day, Flex’s approximately 170,000 employees around the world design, engineer and deliver logistical and manufacturing solutions for customers at more than 100 sites in 30 different countries.
Key Executives
| Name | Title | Year Born |
|---|---|---|
| Ms. Revathi Advaithi | CEO & Director | 1968 |
| Mr. Kevin S. Krumm | Chief Financial Officer | 1974 |
| Mr. Kwanghooi Tan | Chief Operating Officer | 1977 |
| Mr. Michael P. Hartung | President & Chief Commercial Officer | 1968 |
| Mr. D. Scott Offer | Executive VP & General Counsel | 1965 |
| Mr. Daniel J. Wendler | Senior VP & Chief Accounting Officer | 1967 |
| Ms. Michelle Simmons | Senior Vice President of Global Investor Relations & Public Relations | — |
| Mr. Andy Powell | Senior VP and Deputy General Counsel, Chief Ethics & Compliance Officer | 1970 |
| Mr. Rob Campbell | President of Communications, Enterprise & Cloud Business | 1963 |
| Mr. Paul Baldassari | President of Manufacturing & Services | — |
Fundamentals
Valuation
Profitability
Trading
Source: third-party data provider, as of November 11, 2026
Technical indicators
- RSI 14
- 39.40
- MACD 12/26/9
- -8.12
- EMA 9 of MACD
- -7.75
- MACD histogram
- -0.37
- SMA 50
- $101.03
- Price below SMA 50
- EMA 50
- $97.50
- Price below EMA 50
- SMA 200
- $103.55
- Price below SMA 200
- EMA 200
- $95.96
- Price below EMA 200
Calculated by Gotrade from daily closing prices, as of November 10, 2026. Technical data, not a recommendation.
Analyst views
3 analyst ratings
Third-party analyst opinion, not a recommendation from Gotrade.
- Low
- $128.00
- Average
- $142.67
- High
- $150.00
Seasonality
Monthly price change (%)| Jan | Feb | Mar | Apr | May | Jun | Jul | Aug | Sep | Oct | Nov | Dec | |
|---|---|---|---|---|---|---|---|---|---|---|---|---|
| 2021 | -9.9 | +10.0 | ||||||||||
| 2022 | -12.9 | +0.7 | +17.9 | -10.9 | +3.0 | -14.1 | +17.9 | +7.1 | -4.1 | +13.4 | +10.6 | -1.9 |
| 2023 | +8.3 | -4.3 | +1.1 | -8.7 | +22.7 | +8.2 | -1.0 | +1.0 | -1.9 | -3.6 | -1.3 | +17.2 |
| 2024 | -21.7 | +12.4 | -1.3 | +0.7 | +25.8 | -11.1 | +8.4 | +5.9 | +9.8 | +6.0 | +9.8 | -2.1 |
| 2025 | +7.8 | -6.4 | -8.3 | +2.9 | +19.7 | +17.8 | +2.8 | +8.3 | +8.1 | +7.8 | -7.5 | +6.8 |
| 2026 | -1.0 | -2.6 | -0.0 | +34.2 | +64.4 | +9.5 | -25.9 | -7.0 | +2.9 | -23.3 | -9.6 |