
General Mills (GIS) Stock
Key stats
- Market cap
- $19.17B
- Price / Earnings ratio
- -20.4x
- EPS (TTM)
- -$1.64
- Volume
- Loading
- 52-week high
- $49.59
- 52-week low
- $31.18
- Dividend yield
- 6.81%
- Dividend amount (latest)
- $0.61
- EPS vs analyst estimate
- +6.2%Q1 FY26 · $0.86 vs $0.81
Source: third-party data provider, as of November 5, 2026
EPS estimate: analyst consensus
Compare with GIS
Recent news
Kraft Heinz vs. General Mills: Which Dividend Can Avoid Campbell's Fate?
Kraft Heinz vs. General Mills: Which Dividend Can Avoid Campbell's Fate?
GIS
Natural Food Stocks to Gain Momentum as Health Trends Drive Demand
Natural Food Stocks to Gain Momentum as Health Trends Drive Demand
GIS
Conagra and Campbell's Have Already Cut Their Dividends in 2026. Could General Mills Be Next?
Conagra and Campbell's Have Already Cut Their Dividends in 2026. Could General Mills Be Next?
GIS
General Mills Yields Nearly 7%. Is Its Dividend Safer Than Kraft Heinz or Smucker?
General Mills Yields Nearly 7%. Is Its Dividend Safer Than Kraft Heinz or Smucker?
GISNews tone: automated (AI) classification of the article's content, not a price prediction.
Technical indicators
- RSI 14
- 59.71
- MACD 12/26/9
- 0.10
- EMA 9 of MACD
- -0.27
- MACD histogram
- 0.36
- SMA 50
- $35.08
- Price above SMA 50
- EMA 50
- $34.59
- Price above EMA 50
- SMA 200
- $37.35
- Price below SMA 200
- EMA 200
- $38.07
- Price below EMA 200
Calculated by Gotrade from daily closing prices, as of November 4, 2026. Technical data, not a recommendation.
Analyst ratings
Analyst consensus: Hold
Based on 5 analyst ratings
Third-party analyst opinion, not a recommendation from Gotrade.
Financials
Performance
Debt & Balance Sheet
Revenue to Profit
2026Earnings
The market is expecting earnings per share of $0.89 for this quarter. The company has not yet shared when it is announcing earnings.
Source: third-party data provider
Latest news
Kraft Heinz vs. General Mills: Which Dividend Can Avoid Campbell's Fate?
Kraft Heinz vs. General Mills: Which Dividend Can Avoid Campbell's Fate?
GISNatural Food Stocks to Gain Momentum as Health Trends Drive Demand
Natural Food Stocks to Gain Momentum as Health Trends Drive Demand
GISConagra and Campbell's Have Already Cut Their Dividends in 2026. Could General Mills Be Next?
Conagra and Campbell's Have Already Cut Their Dividends in 2026. Could General Mills Be Next?
GISGeneral Mills Yields Nearly 7%. Is Its Dividend Safer Than Kraft Heinz or Smucker?
General Mills Yields Nearly 7%. Is Its Dividend Safer Than Kraft Heinz or Smucker?
GIS
Whirlpool's Dividend Collapse Is a Warning for These 3 High-Yield Stocks
Whirlpool's Dividend Collapse Is a Warning for These 3 High-Yield Stocks
GIS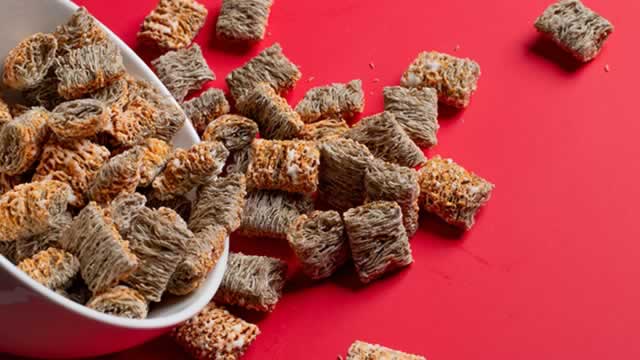
General Mills (GIS) Up 1% Since Last Earnings Report: Can It Continue?
General Mills (GIS) Up 1% Since Last Earnings Report: Can It Continue?
GIS
General Mills Celebrates Upcoming Prime Video Series, ‘The Greatest' with Commemorative Wheaties Box Honoring Legendary Champion, Muhammad Ali
General Mills Celebrates Upcoming Prime Video Series, ‘The Greatest' with Commemorative Wheaties Box Honoring Legendary Champion, Muhammad Ali
GIS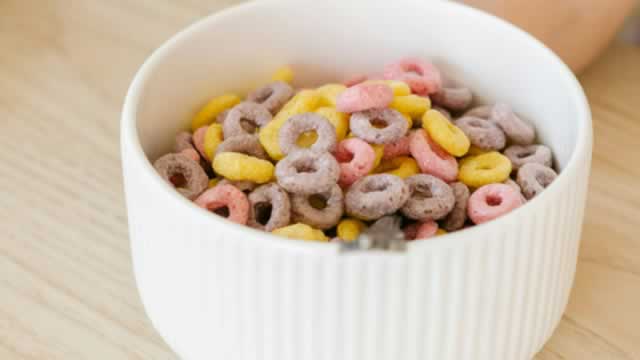
General Mills Stock Is Down 30%, and Wall Street Analysts Keep Cutting Their Price Targets. Here's Why History Says They're Missing the Bigger Picture.
General Mills Stock Is Down 30%, and Wall Street Analysts Keep Cutting Their Price Targets. Here's Why History Says They're Missing the Bigger Picture.
GIS
5 Dividend Stocks Yielding Up to 8% That Could Keep Paying for Years
5 Dividend Stocks Yielding Up to 8% That Could Keep Paying for Years
GIS
Two Food Giants Yield Over 7%. Only One Has the Cash to Back It Up
Two Food Giants Yield Over 7%. Only One Has the Cash to Back It Up
GISNews tone: automated (AI) classification of the article's content, not a price prediction.
About General Mills
We are a leading global manufacturer and marketer of branded consumer foods sold through retail stores.We manufacture our products in 13 countries and market them in more than 100 countries. In addition to our consolidated operations, we have 50 percent interests in two strategic joint ventures that manufacture and market food products sold in more than 130 countries worldwide.
Key Executives
| Name | Title | Year Born |
|---|---|---|
| Mr. Jeffrey L. Harmening | Chairman & CEO | 1967 |
| Mr. Kofi A. Bruce | Chief Financial Officer | 1971 |
| Ms. Dana M. McNabb | COO & Director | 1976 |
| Mr. Jaime Montemayor | Chief Digital, Technology & Transformation Officer | 1964 |
| Mr. Mark A. Pallot | VP & Chief Accounting Officer | 1973 |
| Mr. Jeff Siemon | Vice President of Investor Relations & Corporate Finance | — |
| Ms. Lanette Shaffer Werner | Chief Innovation, Technology & Quality (ITQ) Officer | 1971 |
| Mr. Jano Cabrera | Chief Communications Officer | 1975 |
| Ms. Jacqueline R. Williams-Roll | Chief Human Resources Officer | 1969 |
| Ms. Bethany C. Quam | President of U.S. Morning Foods | 1971 |
Fundamentals
Valuation
Profitability
Trading
Dividend
Source: third-party data provider, as of November 5, 2026
Technical indicators
- RSI 14
- 59.71
- MACD 12/26/9
- 0.10
- EMA 9 of MACD
- -0.27
- MACD histogram
- 0.36
- SMA 50
- $35.08
- Price above SMA 50
- EMA 50
- $34.59
- Price above EMA 50
- SMA 200
- $37.35
- Price below SMA 200
- EMA 200
- $38.07
- Price below EMA 200
Calculated by Gotrade from daily closing prices, as of November 4, 2026. Technical data, not a recommendation.
Analyst views
5 analyst ratings
Third-party analyst opinion, not a recommendation from Gotrade.
- Low
- $33.00
- Average
- $39.20
- High
- $45.00
Seasonality
Monthly price change (%)| Jan | Feb | Mar | Apr | May | Jun | Jul | Aug | Sep | Oct | Nov | Dec | |
|---|---|---|---|---|---|---|---|---|---|---|---|---|
| 2021 | -1.4 | +9.7 | ||||||||||
| 2022 | +2.1 | -1.2 | +1.3 | +2.7 | +0.5 | +9.2 | -1.3 | +1.5 | -0.7 | +4.0 | +6.2 | -1.8 |
| 2023 | -5.8 | +1.9 | +8.4 | +3.2 | -5.8 | -8.6 | -3.1 | -9.0 | -3.4 | +4.3 | -2.2 | +1.6 |
| 2024 | -2.8 | -1.0 | +9.4 | +0.5 | -1.8 | -6.6 | +6.1 | +6.8 | +1.7 | -8.8 | -2.9 | -4.8 |
| 2025 | -5.4 | +1.3 | -3.7 | -5.0 | -2.4 | -4.3 | -7.9 | +0.8 | +2.2 | -8.1 | +2.0 | -1.2 |
| 2026 | +1.2 | -0.9 | -17.5 | -5.1 | -2.6 | +3.5 | -5.3 | +14.4 | -21.7 | +8.3 | +3.2 |
Corporate actions
Upcoming
No upcoming corporate actions for GIS










