
Globalstar, Inc. Common Stock (GSAT) Stock
NASDAQ · GSAT
Key stats
- Market cap
- $11.15B
- Price / Earnings ratio
- -136.8x
- EPS (TTM)
- -$0.64
- Volume
- Loading
- 52-week high
- $86.92
- 52-week low
- $53.67
Source: third-party data provider, as of November 13, 2026
Compare with GSAT
Recent news
Stocktwits
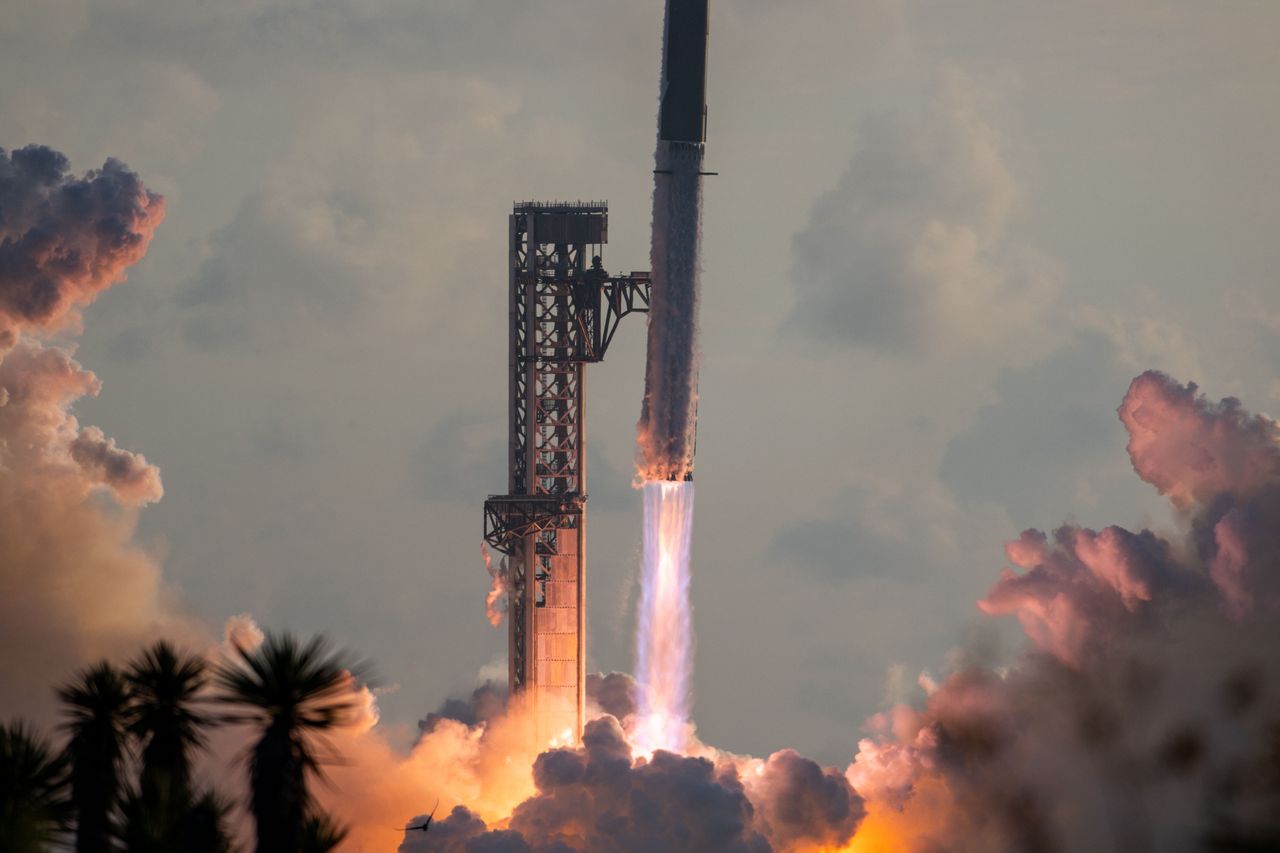
RKLB Vs. SPCX: Which Space Stock Has More Upside As Rocket Lab’s Iridium Deal Deepens Spectrum Feud?
GSATNovember 11, 2026
Stocktwits
RKLB Vs. SPCX: Which Space Stock Has More Upside As Rocket Lab’s Iridium Deal Deepens Spectrum Feud?
GSAT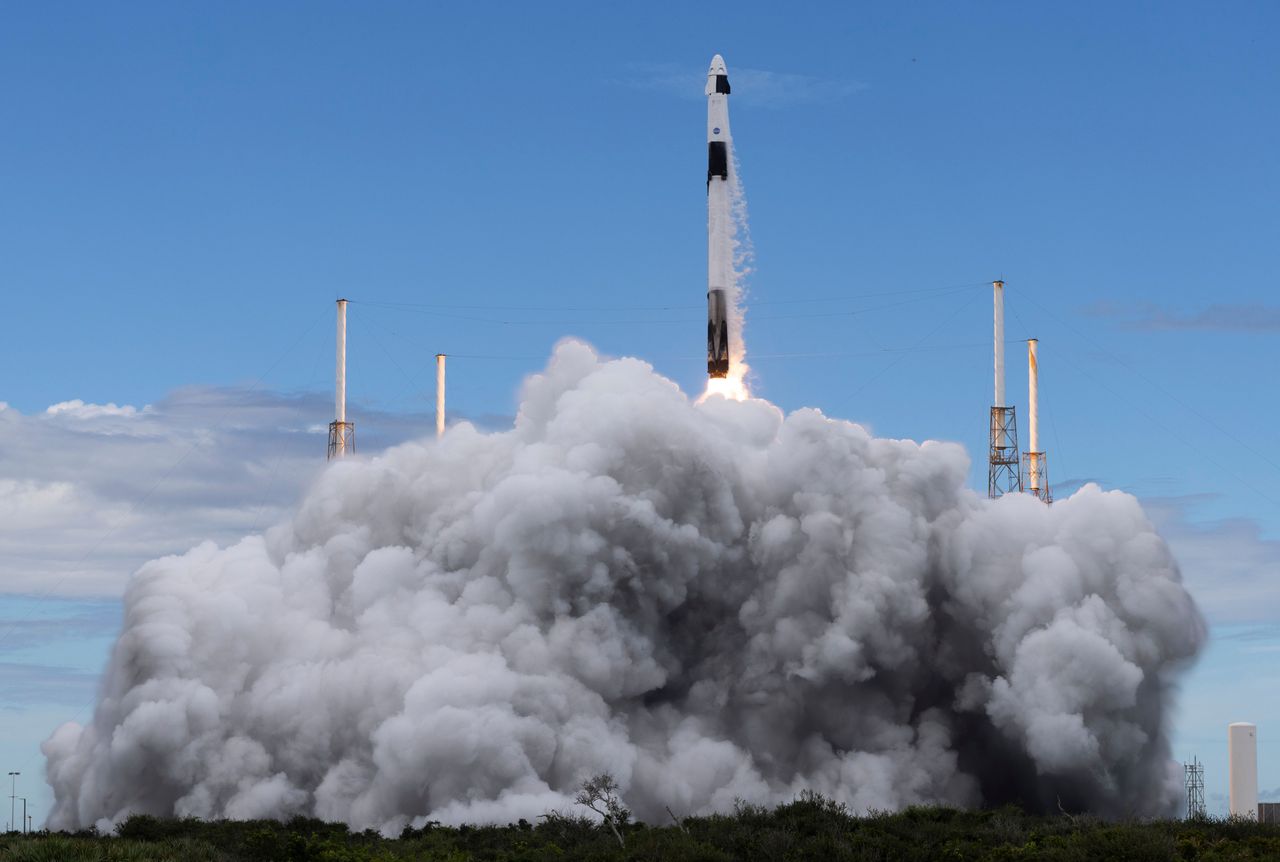
Stocktwits
SpaceX Targets Wireless And AI Riches, Rocket Lab Nears 100 Launches — What’s Moving Space Stocks
GSATNovember 5, 2026
Stocktwits
SpaceX Targets Wireless And AI Riches, Rocket Lab Nears 100 Launches — What’s Moving Space Stocks
GSAT
Stocktwits
RKLB, ASTS, And Other Space Stocks Surged 1,123% And Then Crashed — Chamath Palihapitiya Says ‘What Investors Expect’ Drives Prices
GSATNovember 4, 2026
Stocktwits
RKLB, ASTS, And Other Space Stocks Surged 1,123% And Then Crashed — Chamath Palihapitiya Says ‘What Investors Expect’ Drives Prices
GSAT
Stocktwits
RKLB’s Iridium Deal Draws Heat As Globalstar Echoes SpaceX Concerns — Rocket Lab Seeks Fast FCC Approval
GSATNovember 3, 2026
Stocktwits
RKLB’s Iridium Deal Draws Heat As Globalstar Echoes SpaceX Concerns — Rocket Lab Seeks Fast FCC Approval
GSATTechnical indicators
- RSI 14
- 63.66
- MACD 12/26/9
- 0.71
- EMA 9 of MACD
- 0.41
- MACD histogram
- 0.31
- SMA 50
- $83.06
- Price above SMA 50
- EMA 50
- $83.21
- Price above EMA 50
- SMA 200
- $76.88
- Price above SMA 200
- EMA 200
- $76.33
- Price above EMA 200
Calculated by Gotrade from daily closing prices, as of November 11, 2026. Technical data, not a recommendation.
Analyst ratings
No analyst data available
Financials
Performance
Revenue
Net income
Net margin %
2021
2022
2023
2024
2025
328M216M108M0
Debt & Balance Sheet
Total assets
Total liabilities
2021
2022
2023
2024
2025
3B2B921M0
Revenue to Profit
2025$273.0M
Revenue$0.0
Cost of revenue$176.9M
Gross profit$0.0
Operating expenses$-19.3M
Net incomeEarnings
No data available
Source: third-party data provider
Latest news
Stocktwits
RKLB Vs. SPCX: Which Space Stock Has More Upside As Rocket Lab’s Iridium Deal Deepens Spectrum Feud?
GSATNovember 11, 2026
Stocktwits
RKLB Vs. SPCX: Which Space Stock Has More Upside As Rocket Lab’s Iridium Deal Deepens Spectrum Feud?
GSATStocktwits
SpaceX Targets Wireless And AI Riches, Rocket Lab Nears 100 Launches — What’s Moving Space Stocks
GSATNovember 5, 2026
Stocktwits
SpaceX Targets Wireless And AI Riches, Rocket Lab Nears 100 Launches — What’s Moving Space Stocks
GSATStocktwits
RKLB, ASTS, And Other Space Stocks Surged 1,123% And Then Crashed — Chamath Palihapitiya Says ‘What Investors Expect’ Drives Prices
GSATNovember 4, 2026
Stocktwits
RKLB, ASTS, And Other Space Stocks Surged 1,123% And Then Crashed — Chamath Palihapitiya Says ‘What Investors Expect’ Drives Prices
GSATStocktwits
RKLB’s Iridium Deal Draws Heat As Globalstar Echoes SpaceX Concerns — Rocket Lab Seeks Fast FCC Approval
GSATNovember 3, 2026
Stocktwits
RKLB’s Iridium Deal Draws Heat As Globalstar Echoes SpaceX Concerns — Rocket Lab Seeks Fast FCC Approval
GSAT
Stocktwits
SPCX, ASTS, RKLB Slide Overnight: Amazon Reaffirms 2026 Satellite Service Debut — Retail Weighs Competitive Threat
GSATOctober 30, 2026
Stocktwits
SPCX, ASTS, RKLB Slide Overnight: Amazon Reaffirms 2026 Satellite Service Debut — Retail Weighs Competitive Threat
GSAT
Stocktwits
Amazon Could Buy Viasat As AST SpaceMobile Tries Rival Bid, Satellite Consultant Says: Musk-Bezos ‘Cage Fight’ Looms
GSATOctober 29, 2026
Stocktwits
Amazon Could Buy Viasat As AST SpaceMobile Tries Rival Bid, Satellite Consultant Says: Musk-Bezos ‘Cage Fight’ Looms
GSAT
Stocktwits
ASTS Stock Slips Overnight As FCC Clears Amazon’s $11.5B Globalstar Deal — Touts ‘Even More Competition’
GSATOctober 28, 2026
Stocktwits
ASTS Stock Slips Overnight As FCC Clears Amazon’s $11.5B Globalstar Deal — Touts ‘Even More Competition’
GSAT
Reuters
US agency approves Amazon Leo's $11.5 billion acquisition of Globalstar
PositiveGSATOctober 27, 2026
ReutersPositive
US agency approves Amazon Leo's $11.5 billion acquisition of Globalstar
GSAT
Stocktwits
Why Did Rocket Lab Hike Its Iridium Bid By 30%? Analyst Says ASTS May Have Been Mystery Rival
GSATAugust 27, 2026
Stocktwits
Why Did Rocket Lab Hike Its Iridium Bid By 30%? Analyst Says ASTS May Have Been Mystery Rival
GSAT
Proactive Investors
Rocket Lab launches eight Globalstar satellites
GSATAugust 17, 2026
Proactive Investors
Rocket Lab launches eight Globalstar satellites
GSATNews tone: automated (AI) classification of the article's content, not a price prediction.
About Globalstar, Inc. Common Stock
No description available.
SectorCommunication Services
IndustryTelecom Services
Employees477
CEODr. Paul E. Jacobs Ph.D.
IPO DateNov 2, 2006
HeadquartersCovington, LA
Key Executives
| Name | Title | Year Born |
|---|---|---|
| Dr. Paul E. Jacobs Ph.D. | CEO & Director | 1962 |
| Mr. James Monroe III | Executive Chairman | 1955 |
| Ms. Rebecca S. Clary CPA | VP, CFO & Corporate Secretary | 1979 |
| Mr. L. Barbee Ponder IV | General Counsel & VP of Regulatory Affairs | 1967 |
| Mr. Timothy Evan Taylor | VP of Finance, Business Operations & Strategy and Director | 1982 |
| Mr. Matthew S. Grob | Chief Technology Officer | 1966 |
| Mr. Peter Black | Chief Scientist | — |
| Mr. Kyle Pickens CFA | Vice President of Strategy & Communications | — |
| Mr. Jake Rembert | Vice President of Sales - United States, Africa and Central & South America | — |
| Mr. Mersad Cavcic | Chief Product Officer | — |
Fundamentals
Valuation
Price-to-sales ratio40.32
Price-to-book value40.40
PEG ratio0.50
Profitability
Return on Equity-26.00%
Return on Assets-3.00%
Return on Sales2.00%
Gross margin (latest quarter)58.96%
EBITDA$78.49M
Trading
Average volume979,795
Source: third-party data provider, as of November 13, 2026
Technical indicators
- RSI 14
- 63.66
- MACD 12/26/9
- 0.71
- EMA 9 of MACD
- 0.41
- MACD histogram
- 0.31
- SMA 50
- $83.06
- Price above SMA 50
- EMA 50
- $83.21
- Price above EMA 50
- SMA 200
- $76.88
- Price above SMA 200
- EMA 200
- $76.33
- Price above EMA 200
Calculated by Gotrade from daily closing prices, as of November 11, 2026. Technical data, not a recommendation.
Analyst views
No analyst data available
Seasonality
Monthly price change (%)| Jan | Feb | Mar | Apr | May | Jun | Jul | Aug | Sep | Oct | Nov | Dec | |
|---|---|---|---|---|---|---|---|---|---|---|---|---|
| 2021 | -13.1 | -12.1 | ||||||||||
| 2022 | -6.1 | +6.3 | +22.5 | -21.6 | +20.7 | -5.4 | +13.8 | +44.9 | -20.5 | +28.4 | -16.7 | -28.5 |
| 2023 | +8.5 | -9.2 | -1.7 | -20.5 | +26.7 | -2.7 | +0.0 | +27.4 | -11.5 | +15.6 | +13.6 | +25.2 |
| 2024 | -15.0 | -7.1 | -0.7 | -4.4 | -15.5 | +0.9 | +13.1 | +9.6 | -3.1 | -11.0 | +41.3 | +7.3 |
| 2025 | -27.8 | -4.0 | -0.4 | -7.2 | -6.2 | +26.8 | +1.5 | +29.3 | +19.9 | +38.9 | +20.6 | +1.5 |
| 2026 | -3.7 | +2.5 | +7.1 | +20.1 | +3.1 | -1.5 | +3.0 | -3.1 | +1.9 | -0.7 | +3.7 |
Compare stocks
Market cap
$11.15B
-
-
-
Price / Earnings ratio
-136.80
-
-
-
Price / Sales ratio
40.32
-
-
-
Dividend yield
0.00%
-
-
-
Average volume
979,795
-
-
-
Earnings per share
$-0.64
-
-
-










