
Garrett Motion Inc (GTX) Stock
Key stats
- Market cap
- $3.88B
- Price / Earnings ratio
- 10.1x
- EPS (TTM)
- $1.99
- Volume
- Loading
- 52-week high
- $36.25
- 52-week low
- $15.54
- Dividend yield
- 1.52%
- Dividend amount (latest)
- $0.08
Source: third-party data provider, as of November 13, 2026
Compare with GTX
Recent news
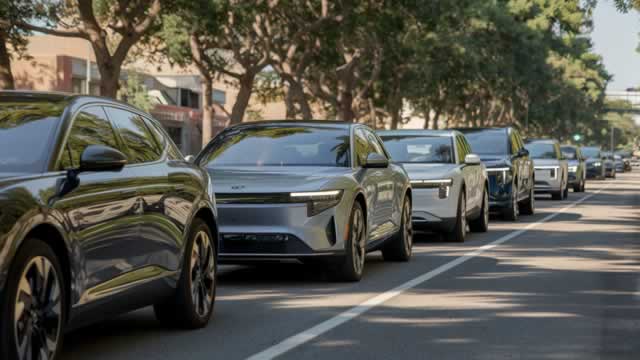
Garrett Motion Sees Growth Beyond Turbos in Industrial Compression, Electrification
Garrett Motion Sees Growth Beyond Turbos in Industrial Compression, Electrification
GTX
What Garrett Motion (GTX) Said on Its Q3 Earnings Call
What Garrett Motion (GTX) Said on Its Q3 Earnings Call
GTX
Garrett Motion (GTX) Q3 Earnings Surpass Estimates
Garrett Motion (GTX) Q3 Earnings Surpass Estimates
GTX
Garrett Motion (GTX) Reports Next Week: Wall Street Expects Earnings Growth
Garrett Motion (GTX) Reports Next Week: Wall Street Expects Earnings Growth
GTXNews tone: automated (AI) classification of the article's content, not a price prediction.
Technical indicators
- RSI 14
- 39.59
- MACD 12/26/9
- -1.30
- EMA 9 of MACD
- -1.36
- MACD histogram
- 0.07
- SMA 50
- $24.53
- Price below SMA 50
- EMA 50
- $24.01
- Price below EMA 50
- SMA 200
- $25.48
- Price below SMA 200
- EMA 200
- $23.87
- Price below EMA 200
Calculated by Gotrade from daily closing prices, as of November 11, 2026. Technical data, not a recommendation.
Analyst ratings
Analyst consensus: Buy
Based on 3 analyst ratings
Third-party analyst opinion, not a recommendation from Gotrade.
Financials
Performance
Debt & Balance Sheet
Revenue to Profit
2025Earnings
The market is expecting earnings per share of $0.41 for this quarter. The company has not yet shared when it is announcing earnings.
Source: third-party data provider
Latest news
Garrett Motion Sees Growth Beyond Turbos in Industrial Compression, Electrification
Garrett Motion Sees Growth Beyond Turbos in Industrial Compression, Electrification
GTXWhat Garrett Motion (GTX) Said on Its Q3 Earnings Call
What Garrett Motion (GTX) Said on Its Q3 Earnings Call
GTXGarrett Motion (GTX) Q3 Earnings Surpass Estimates
Garrett Motion (GTX) Q3 Earnings Surpass Estimates
GTXGarrett Motion (GTX) Reports Next Week: Wall Street Expects Earnings Growth
Garrett Motion (GTX) Reports Next Week: Wall Street Expects Earnings Growth
GTX
Here's Why Garrett Motion (GTX) is a Strong Momentum Stock
Here's Why Garrett Motion (GTX) is a Strong Momentum Stock
GTX
3 Reasons Why Growth Investors Shouldn't Overlook Garrett Motion (GTX)
3 Reasons Why Growth Investors Shouldn't Overlook Garrett Motion (GTX)
GTX
Why Garrett Motion (GTX) is a Top Growth Stock for the Long-Term
Why Garrett Motion (GTX) is a Top Growth Stock for the Long-Term
GTX
Here's Why Garrett Motion (GTX) is a Strong Value Stock
Here's Why Garrett Motion (GTX) is a Strong Value Stock
GTX
Is GARRETT MOTION (GTX) Stock Outpacing Its Auto-Tires-Trucks Peers This Year?
Is GARRETT MOTION (GTX) Stock Outpacing Its Auto-Tires-Trucks Peers This Year?
GTX
Why Garrett Motion (GTX) is a Top Value Stock for the Long-Term
Why Garrett Motion (GTX) is a Top Value Stock for the Long-Term
GTXNews tone: automated (AI) classification of the article's content, not a price prediction.
About Garrett Motion Inc
Garrett Motion Inc designs, manufactures and sells engineered turbocharger and electric-boosting technologies for light and commercial vehicle original equipment manufacturers (OEMs). The company is a technology leader with expertise in delivering products across gasoline, diesel, natural gas and electrified powertrains. The company also sells its technologies in the aftermarket through its distribution network. The company derives maximum of its revenue from Gas and geographically from Europe.
Key Executives
| Name | Title | Year Born |
|---|---|---|
| Mr. Olivier Rabiller | President, CEO & Director | 1971 |
| Mr. Sean Ernest Deason C.M.A. | Senior VP & CFO | 1972 |
| Mr. Craig Balis | Senior VP & CTO | 1965 |
| Mr. Thierry Mabru | Senior Vice President of Integrated Supply Chain | 1968 |
| Ms. Joanne Lau | VP, Chief Accounting Officer & Corporate Controller | 1978 |
| Mr. Thomas Peter | Senior VP & Chief Digital & Information Officer | — |
| Mr. Mark Rollinger | Senior VP, General Counsel & Corporate Secretary | 1969 |
| Mr. Fabrice Spenninck | Senior VP & Chief Human Resources Officer | 1969 |
| Mr. Eric Fraysse | President Global Aftermarket, Brazil & India | — |
| Mr. Charles Jin | President of High Growth Regions China & India | — |
Fundamentals
Valuation
Profitability
Trading
Dividend
Source: third-party data provider, as of November 13, 2026
Technical indicators
- RSI 14
- 39.59
- MACD 12/26/9
- -1.30
- EMA 9 of MACD
- -1.36
- MACD histogram
- 0.07
- SMA 50
- $24.53
- Price below SMA 50
- EMA 50
- $24.01
- Price below EMA 50
- SMA 200
- $25.48
- Price below SMA 200
- EMA 200
- $23.87
- Price below EMA 200
Calculated by Gotrade from daily closing prices, as of November 11, 2026. Technical data, not a recommendation.
Analyst views
3 analyst ratings
Third-party analyst opinion, not a recommendation from Gotrade.
- Low
- $31.00
- Average
- $36.00
- High
- $42.00
Seasonality
Monthly price change (%)| Jan | Feb | Mar | Apr | May | Jun | Jul | Aug | Sep | Oct | Nov | Dec | |
|---|---|---|---|---|---|---|---|---|---|---|---|---|
| 2021 | -9.7 | +9.0 | ||||||||||
| 2022 | -10.8 | +0.3 | +3.6 | -7.1 | -10.7 | +31.2 | -17.9 | +3.6 | -17.8 | +11.6 | +3.4 | +2.3 |
| 2023 | +1.3 | -7.9 | -2.3 | +7.1 | -0.8 | -11.3 | +2.9 | -1.6 | +2.7 | -6.6 | +3.1 | +27.6 |
| 2024 | -9.4 | +8.9 | +0.7 | -4.1 | -3.3 | -6.9 | +2.5 | -1.9 | +0.2 | -8.7 | +12.3 | +6.6 |
| 2025 | +7.5 | +2.7 | -13.2 | +14.0 | +3.9 | +3.1 | +21.6 | +0.8 | +3.8 | +23.3 | -4.5 | +5.6 |
| 2026 | +3.8 | +11.6 | -9.4 | +37.7 | +26.6 | +16.1 | -7.3 | -11.9 | -2.1 | -20.3 | +3.9 |