High-Trend International Group Class A Ordinary Shares (HTCO) Stock
Key stats
- Market cap
- $10.69M
- Price / Earnings ratio
- -0.6x
- EPS (TTM)
- $6.00
- Volume
- Loading
- 52-week high
- $56.59
- 52-week low
- $0.90
Source: third-party data provider, as of October 23, 2026
Compare with HTCO
Technical indicators
- RSI 14
- 34.33
- MACD 12/26/9
- -0.34
- EMA 9 of MACD
- -0.34
- MACD histogram
- -0.00
- SMA 50
- $2.17
- Price below SMA 50
- EMA 50
- $2.13
- Price below EMA 50
- SMA 200
- $5.93
- Price below SMA 200
- EMA 200
- $5.71
- Price below EMA 200
Calculated by Gotrade from daily closing prices, as of October 22, 2026. Technical data, not a recommendation.
Analyst ratings
No analyst data available
Financials
Performance
No data available
Debt & Balance Sheet
No data available
Revenue to Profit
No data available
Earnings
No data available
Source: third-party data provider
About High-Trend International Group Class A Ordinary Shares
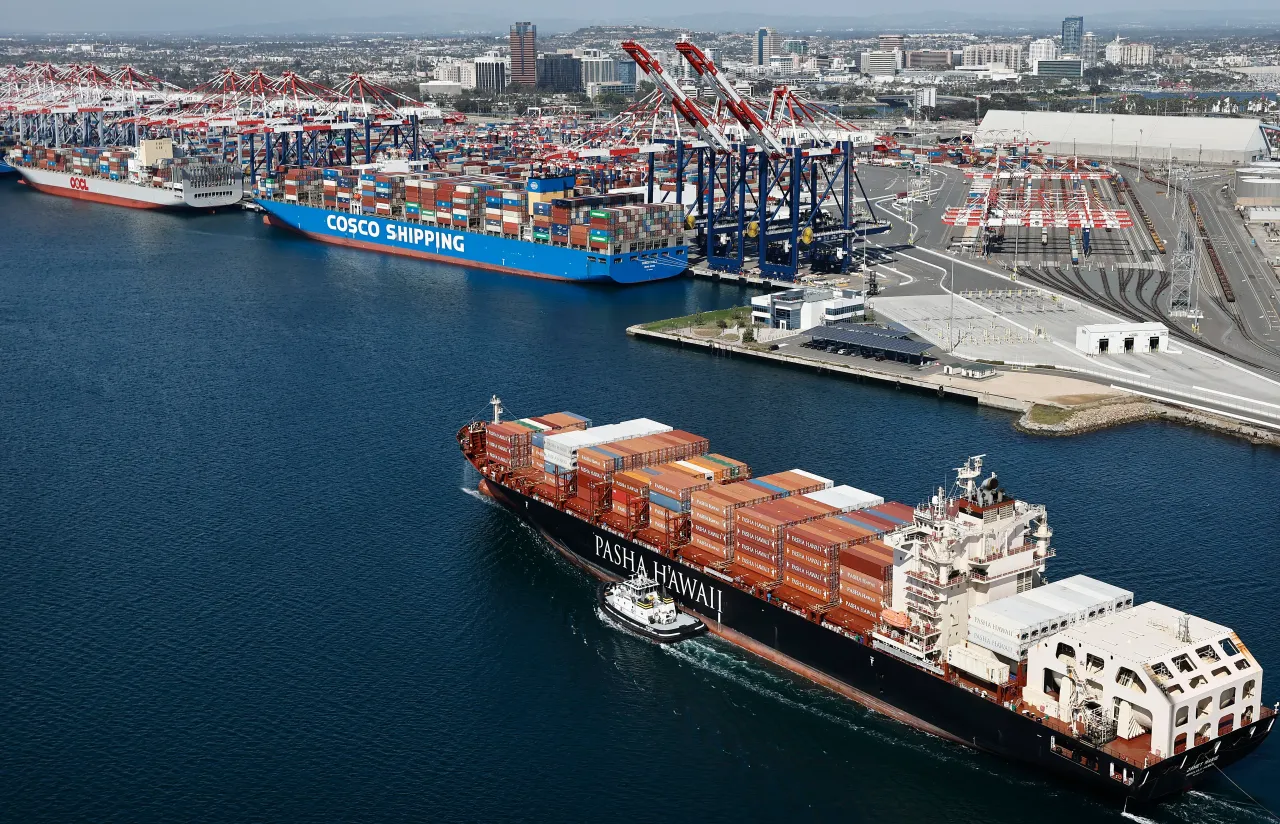
High-Trend International Group is an international operator of ocean transportation services. It is engaged in seaborne transportation services under voyage contracts, as well as vessel services for and on behalf of ship owners. The company has two operating segments, namely, ocean transport and Heating business. The company derives the majority of its revenue from the Ocean transportation business. The company derives freight revenue from voyage contracts and provides vessel service. The majority of revenue is from providing shipping services for customers in Asia, principally in Singapore, Dubai, Korea, Japan, and India.
Key Executives
| Name | Title | Year Born |
|---|---|---|
| Mr. Shixuan He | CEO & Director | 1976 |
| Ms. Zi Xia | CFO & Director | 1979 |
| Mr. Dong Zhang | co-founder | 1982 |
| Mr. Bo Cui | Chief Legal Officer | — |
| Mr. Shahryar Oveissi | Chief Capital Markets Officer | 1979 |
Fundamentals
Valuation
Profitability
Trading
Source: third-party data provider, as of October 23, 2026
Technical indicators
- RSI 14
- 34.33
- MACD 12/26/9
- -0.34
- EMA 9 of MACD
- -0.34
- MACD histogram
- -0.00
- SMA 50
- $2.17
- Price below SMA 50
- EMA 50
- $2.13
- Price below EMA 50
- SMA 200
- $5.93
- Price below SMA 200
- EMA 200
- $5.71
- Price below EMA 200
Calculated by Gotrade from daily closing prices, as of October 22, 2026. Technical data, not a recommendation.
Analyst views
No analyst data available
Seasonality
Monthly price change (%)| Jan | Feb | Mar | Apr | May | Jun | Jul | Aug | Sep | Oct | Nov | Dec | |
|---|---|---|---|---|---|---|---|---|---|---|---|---|
| 2026 | -32.5 | -66.8 | +65.1 | -16.1 | -27.4 | -21.3 | -50.2 |