
Howmet Aerospace (HWM) Stock
Key stats
- Market cap
- $89.08B
- Price / Earnings ratio
- 42.4x
- EPS (TTM)
- $5.12
- Volume
- Loading
- 52-week high
- $310.00
- 52-week low
- $183.52
- Dividend yield
- 0.23%
- Dividend amount (latest)
- $0.14
- EPS vs analyst estimate
- +4.4%Q3 FY25 · $0.95 vs $0.91
Source: third-party data provider, as of November 13, 2026
EPS estimate: analyst consensus
Compare with HWM
Recent news
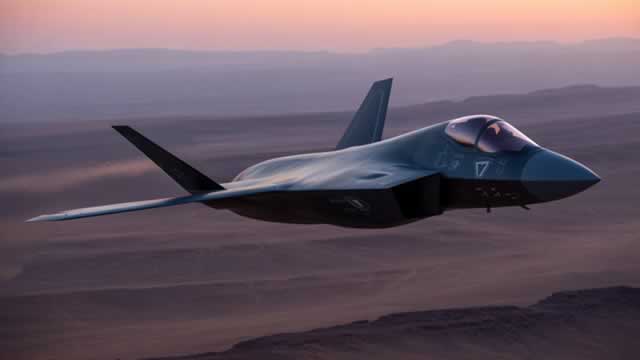
Howmet Aerospace's Q3 Aerospace Demand Surges: Can Growth Continue?
Howmet Aerospace's Q3 Aerospace Demand Surges: Can Growth Continue?
HWM
Implied Volatility Surging for Howmet Aerospace Stock Options
Implied Volatility Surging for Howmet Aerospace Stock Options
HWM
3 Reasons Why Growth Investors Shouldn't Overlook Howmet (HWM)
3 Reasons Why Growth Investors Shouldn't Overlook Howmet (HWM)
HWM
Howmet Aerospace Q3 Earnings Call Highlights
Howmet Aerospace Q3 Earnings Call Highlights
HWMNews tone: automated (AI) classification of the article's content, not a price prediction.
Technical indicators
- RSI 14
- 55.69
- MACD 12/26/9
- -1.79
- EMA 9 of MACD
- -5.11
- MACD histogram
- 3.32
- SMA 50
- $221.34
- Price above SMA 50
- EMA 50
- $223.44
- Price above EMA 50
- SMA 200
- $248.49
- Price below SMA 200
- EMA 200
- $234.79
- Price below EMA 200
Calculated by Gotrade from daily closing prices, as of November 11, 2026. Technical data, not a recommendation.
Analyst ratings
Analyst consensus: Buy
Based on 11 analyst ratings
Third-party analyst opinion, not a recommendation from Gotrade.
Financials
Performance
Debt & Balance Sheet
Revenue to Profit
2025Earnings
The market is expecting earnings per share of $1.15 for this quarter. The company has not yet shared when it is announcing earnings.
Source: third-party data provider
Latest news
Howmet Aerospace's Q3 Aerospace Demand Surges: Can Growth Continue?
Howmet Aerospace's Q3 Aerospace Demand Surges: Can Growth Continue?
HWMImplied Volatility Surging for Howmet Aerospace Stock Options
Implied Volatility Surging for Howmet Aerospace Stock Options
HWM3 Reasons Why Growth Investors Shouldn't Overlook Howmet (HWM)
3 Reasons Why Growth Investors Shouldn't Overlook Howmet (HWM)
HWMHowmet Aerospace Q3 Earnings Call Highlights
Howmet Aerospace Q3 Earnings Call Highlights
HWM
HWM Q3 Earnings Beat Estimates on Aerospace, Gas Turbine Growth
HWM Q3 Earnings Beat Estimates on Aerospace, Gas Turbine Growth
HWM
HWM Q3 Earnings Call Highlights a Longer Gas Turbine Runway
HWM Q3 Earnings Call Highlights a Longer Gas Turbine Runway
HWM
Howmet (HWM) Q3 Earnings: Taking a Look at Key Metrics Versus Estimates
Howmet (HWM) Q3 Earnings: Taking a Look at Key Metrics Versus Estimates
HWM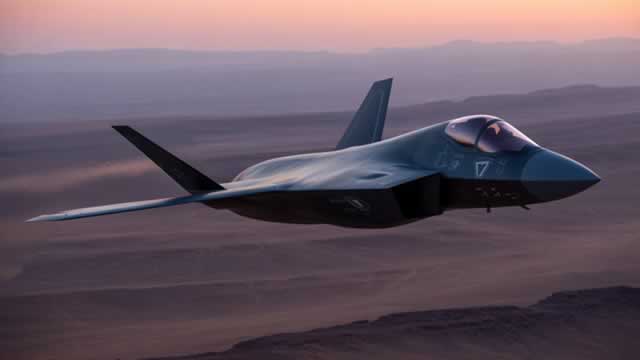
Howmet: 3 Key Takeaways for Long-Term Investors
Howmet: 3 Key Takeaways for Long-Term Investors
HWM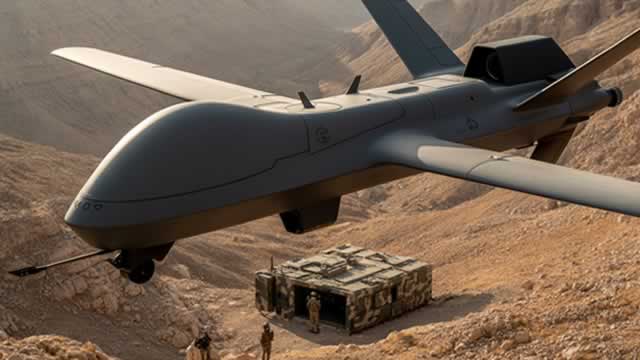
Why Howmet Stock Is Flying Higher Today
Why Howmet Stock Is Flying Higher Today
HWM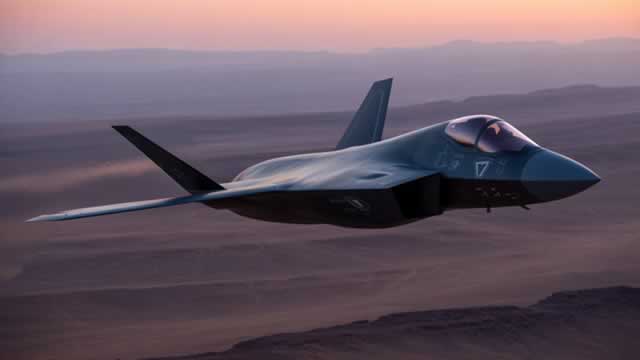
Howmet (HWM) Surpasses Q3 Earnings and Revenue Estimates
Howmet (HWM) Surpasses Q3 Earnings and Revenue Estimates
HWMNews tone: automated (AI) classification of the article's content, not a price prediction.
About Howmet Aerospace
We’re a company of innovators and makers. We help make quieter, more fuel-efficient engines for airplanes and gas turbines. Our market-leading aluminum wheels help trucks save fuel and reduce maintenance while rolling in style.
Key Executives
| Name | Title | Year Born |
|---|---|---|
| Mr. John C. Plant FCA | Executive Chairman & CEO | 1954 |
| Mr. Patrick Joseph Winterlich | Executive VP & CFO | 1970 |
| Mr. Neil E. Marchuk | Executive VP & Chief Administrative Officer | 1958 |
| Mr. Michael Niem Chanatry | VP & Chief Commercial Officer | 1960 |
| Mr. W. Paul Myron | Vice President of Finance, Strategy & Operations | 1966 |
| Mr. Paul Thomas Luther Jr. | Vice President of Investor Relations | — |
| Mr. Jonathan A. Arena | Executive VP, Chief Legal and Compliance Officer & Secretary | — |
| Ms. Ann Humphrey | Chief Human Resources Officer & VP | — |
| Mr. Randall Scheps | President of Forged Wheels | 1968 |
| Ms. Margaret S. Lam Esq. | Assistant Secretary, Associate General Counsel and Chief Securities & Governance Counsel | — |
Fundamentals
Valuation
Profitability
Trading
Dividend
Source: third-party data provider, as of November 13, 2026
Technical indicators
- RSI 14
- 55.69
- MACD 12/26/9
- -1.79
- EMA 9 of MACD
- -5.11
- MACD histogram
- 3.32
- SMA 50
- $221.34
- Price above SMA 50
- EMA 50
- $223.44
- Price above EMA 50
- SMA 200
- $248.49
- Price below SMA 200
- EMA 200
- $234.79
- Price below EMA 200
Calculated by Gotrade from daily closing prices, as of November 11, 2026. Technical data, not a recommendation.
Analyst views
11 analyst ratings
Third-party analyst opinion, not a recommendation from Gotrade.
- Low
- $230.00
- Average
- $285.00
- High
- $350.00
Seasonality
Monthly price change (%)| Jan | Feb | Mar | Apr | May | Jun | Jul | Aug | Sep | Oct | Nov | Dec | |
|---|---|---|---|---|---|---|---|---|---|---|---|---|
| 2021 | -14.9 | +16.1 | ||||||||||
| 2022 | -3.8 | +13.6 | +8.5 | -6.1 | +5.7 | -11.9 | +16.8 | -5.1 | -11.8 | +10.8 | +3.2 | +2.6 |
| 2023 | +4.2 | +3.9 | -1.0 | +3.1 | -3.5 | +13.3 | +4.1 | +1.0 | -6.9 | -2.9 | +17.6 | +2.3 |
| 2024 | +4.7 | +16.0 | +2.1 | +1.0 | +26.8 | -8.3 | +23.8 | +1.9 | +7.8 | -1.2 | +18.3 | -7.1 |
| 2025 | +14.3 | +8.1 | -1.0 | +5.2 | +14.8 | +7.8 | +2.0 | -5.5 | +13.3 | +5.7 | -1.0 | +3.2 |
| 2026 | -1.7 | +26.7 | -13.1 | +1.7 | +7.8 | +5.2 | +5.6 | -14.5 | -11.3 | -12.8 | +5.2 |










