
iShares Global Clean Energy (ICLN) Stock
Key stats
- Market cap
- $2.21B
- Volume
- Loading
- 52-week high
- $23.78
- 52-week low
- $15.18
Source: third-party data provider, as of November 13, 2026
Recent news

Alerian MLP ETF vs. iShares Global Clean Energy ETF: Alerian MLP ETF vs.
Alerian MLP ETF vs. iShares Global Clean Energy ETF: Alerian MLP ETF vs.
ICLN
Better Clean Energy ETF: VanEck's Nuclear-Focused NLR vs. the iShares ICLN Targeting Renewables
Better Clean Energy ETF: VanEck's Nuclear-Focused NLR vs. the iShares ICLN Targeting Renewables
ICLN
Better Energy Sector ETF: Vanguard's VDE Focused on Oil and Gas vs. the iShares ICLN Targeting Clean Energy
Better Energy Sector ETF: Vanguard's VDE Focused on Oil and Gas vs. the iShares ICLN Targeting Clean Energy
ICLN
Bloom Energy Gains Another ‘Meaningful’ Proof Point With Project Phoenix, Says RBC — 2 GW Build Reinforces Data Center Opportunity
Bloom Energy Gains Another ‘Meaningful’ Proof Point With Project Phoenix, Says RBC — 2 GW Build Reinforces Data Center Opportunity
ICLNNews tone: automated (AI) classification of the article's content, not a price prediction.
Technical indicators
- RSI 14
- 48.26
- MACD 12/26/9
- -0.17
- EMA 9 of MACD
- -0.27
- MACD histogram
- 0.10
- SMA 50
- $16.89
- Price below SMA 50
- EMA 50
- $16.81
- Price below EMA 50
- SMA 200
- $18.72
- Price below SMA 200
- EMA 200
- $17.96
- Price below EMA 200
Calculated by Gotrade from daily closing prices, as of November 11, 2026. Technical data, not a recommendation.
Analyst ratings
No analyst data available
Financials
Performance
No data available
Debt & Balance Sheet
No data available
Revenue to Profit
No data available
Earnings
No data available
Source: third-party data provider
Latest news
Alerian MLP ETF vs. iShares Global Clean Energy ETF: Alerian MLP ETF vs.
Alerian MLP ETF vs. iShares Global Clean Energy ETF: Alerian MLP ETF vs.
ICLNBetter Clean Energy ETF: VanEck's Nuclear-Focused NLR vs. the iShares ICLN Targeting Renewables
Better Clean Energy ETF: VanEck's Nuclear-Focused NLR vs. the iShares ICLN Targeting Renewables
ICLNBetter Energy Sector ETF: Vanguard's VDE Focused on Oil and Gas vs. the iShares ICLN Targeting Clean Energy
Better Energy Sector ETF: Vanguard's VDE Focused on Oil and Gas vs. the iShares ICLN Targeting Clean Energy
ICLNBloom Energy Gains Another ‘Meaningful’ Proof Point With Project Phoenix, Says RBC — 2 GW Build Reinforces Data Center Opportunity
Bloom Energy Gains Another ‘Meaningful’ Proof Point With Project Phoenix, Says RBC — 2 GW Build Reinforces Data Center Opportunity
ICLN
Better Clean Energy ETF: Broad Exposure Through iShares' ICLN vs. Invesco's Solar-Focused TAN
Better Clean Energy ETF: Broad Exposure Through iShares' ICLN vs. Invesco's Solar-Focused TAN
ICLN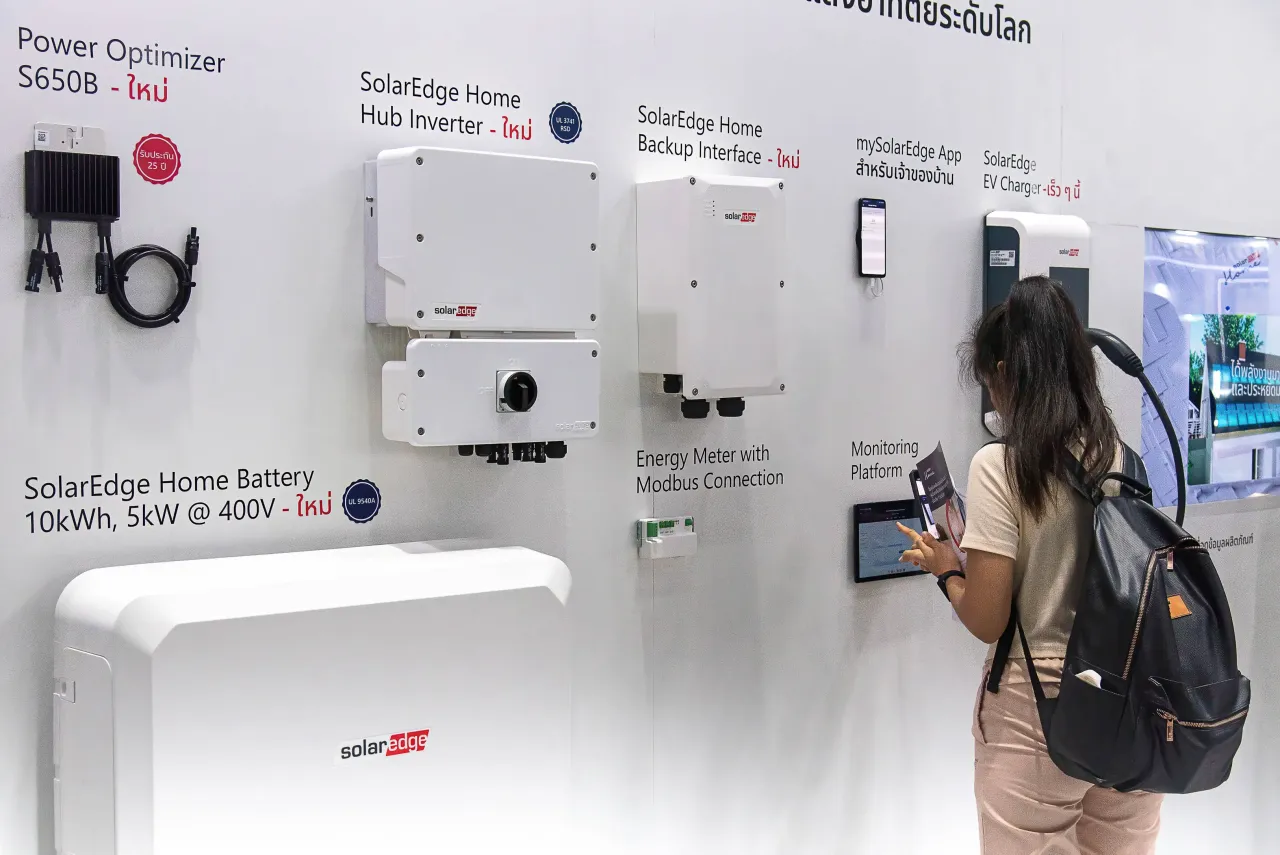
SolarEdge Targets $2.4B Revenue By 2029 – A Look At Some Highlights From Its 2026 Investor Day
SolarEdge Targets $2.4B Revenue By 2029 – A Look At Some Highlights From Its 2026 Investor Day
ICLN
ETFs in Spotlight as Bloom Energy is Set to Join the S&P 500 Index
ETFs in Spotlight as Bloom Energy is Set to Join the S&P 500 Index
ICLN
Energy Stock Showdown: MLPX Beats ICLN on Yield and Returns
Energy Stock Showdown: MLPX Beats ICLN on Yield and Returns
ICLN
BE Stock Outpaces Clean Energy ETFs: Is Wall Street Repricing Bloom Energy As AI Infrastructure Play?
BE Stock Outpaces Clean Energy ETFs: Is Wall Street Repricing Bloom Energy As AI Infrastructure Play?
ICLN
Better Energy ETF: First Trust's EMLP Targeting Fossil Fuels vs. the iShares Clean Energy-Focused ICLN
Better Energy ETF: First Trust's EMLP Targeting Fossil Fuels vs. the iShares Clean Energy-Focused ICLN
ICLNNews tone: automated (AI) classification of the article's content, not a price prediction.
About iShares Global Clean Energy
ICLN specializes in firms that are engaged in geothermal, hydroelectric, solar, wind, biofuels, and ethanol production as well as other forms of clean energy production. ICLN covers enterprises that create technology and equipment needed in the process in addition to holding companies that produce energy using these methods.
Fundamentals
Trading
Dividend
Source: third-party data provider, as of November 13, 2026
Technical indicators
- RSI 14
- 48.26
- MACD 12/26/9
- -0.17
- EMA 9 of MACD
- -0.27
- MACD histogram
- 0.10
- SMA 50
- $16.89
- Price below SMA 50
- EMA 50
- $16.81
- Price below EMA 50
- SMA 200
- $18.72
- Price below SMA 200
- EMA 200
- $17.96
- Price below EMA 200
Calculated by Gotrade from daily closing prices, as of November 11, 2026. Technical data, not a recommendation.
Analyst views
No analyst data available
Seasonality
Monthly price change (%)| Jan | Feb | Mar | Apr | May | Jun | Jul | Aug | Sep | Oct | Nov | Dec | |
|---|---|---|---|---|---|---|---|---|---|---|---|---|
| 2021 | -5.2 | -7.0 | ||||||||||
| 2022 | -12.1 | +10.6 | +4.9 | -12.9 | +5.4 | -3.1 | +15.4 | +0.8 | -12.4 | -4.0 | +11.8 | -5.3 |
| 2023 | +5.7 | -8.4 | +1.5 | -4.3 | -1.0 | -1.4 | -0.7 | -10.8 | -9.0 | -7.5 | +10.4 | +6.7 |
| 2024 | -10.3 | -2.4 | -1.1 | -5.3 | +13.0 | -11.7 | +6.3 | +2.2 | +5.6 | -9.7 | -5.8 | -8.4 |
| 2025 | -2.0 | -1.2 | +4.4 | +2.4 | +7.9 | +4.1 | +1.4 | +6.4 | +9.3 | +8.9 | -3.5 | -0.7 |
| 2026 | +6.1 | -0.1 | -0.2 | +13.8 | +12.5 | -11.1 | -13.0 | -3.8 | -1.4 | -9.1 | +3.5 |
Corporate actions
Upcoming
No upcoming corporate actions for ICLN










