
iShares US Home Construction ETF (ITB) Stock
Key stats
- Market cap
- $1.46B
- Volume
- Loading
- 52-week high
- $115.26
- 52-week low
- $82.08
Source: third-party data provider, as of November 13, 2026
Recent news
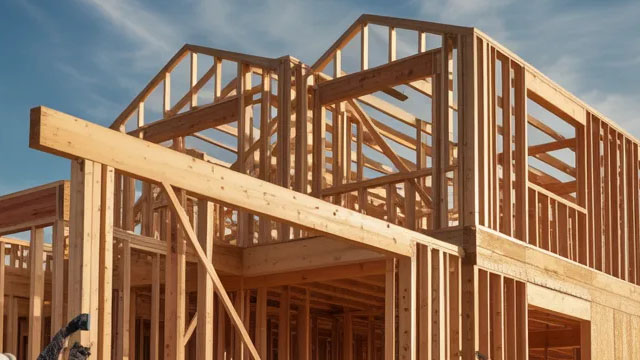
The housing market is 'really stuck in the mud', says OnePoint's Peter Boockvar
The housing market is 'really stuck in the mud', says OnePoint's Peter Boockvar
ITB
US homebuilder sentiment tumbles to near 14-1/2-year low in October
US homebuilder sentiment tumbles to near 14-1/2-year low in October
ITB
Should You Invest in the iShares U.S. Home Construction ETF (ITB)?
Should You Invest in the iShares U.S. Home Construction ETF (ITB)?
ITB
LEN Stock Heads For Monthly Loss: CEO Warns Higher ‘Interest Rates Test Affordability' After Weak Outlook
LEN Stock Heads For Monthly Loss: CEO Warns Higher ‘Interest Rates Test Affordability' After Weak Outlook
ITBNews tone: automated (AI) classification of the article's content, not a price prediction.
Technical indicators
- RSI 14
- 55.29
- MACD 12/26/9
- 2.43
- EMA 9 of MACD
- 1.89
- MACD histogram
- 0.53
- SMA 50
- $89.83
- Price above SMA 50
- EMA 50
- $91.92
- Price above EMA 50
- SMA 200
- $95.70
- Price below SMA 200
- EMA 200
- $95.20
- Price above EMA 200
Calculated by Gotrade from daily closing prices, as of November 11, 2026. Technical data, not a recommendation.
Analyst ratings
No analyst data available
Financials
Performance
No data available
Debt & Balance Sheet
No data available
Revenue to Profit
No data available
Earnings
No data available
Source: third-party data provider
Latest news
The housing market is 'really stuck in the mud', says OnePoint's Peter Boockvar
The housing market is 'really stuck in the mud', says OnePoint's Peter Boockvar
ITBUS homebuilder sentiment tumbles to near 14-1/2-year low in October
US homebuilder sentiment tumbles to near 14-1/2-year low in October
ITBShould You Invest in the iShares U.S. Home Construction ETF (ITB)?
Should You Invest in the iShares U.S. Home Construction ETF (ITB)?
ITBLEN Stock Heads For Monthly Loss: CEO Warns Higher ‘Interest Rates Test Affordability' After Weak Outlook
LEN Stock Heads For Monthly Loss: CEO Warns Higher ‘Interest Rates Test Affordability' After Weak Outlook
ITB
Fed Most Likely to Hike Rates After 3 Years: ETFs to Win/Lose
Fed Most Likely to Hike Rates After 3 Years: ETFs to Win/Lose
ITB
New home sales hit lowest level since January
New home sales hit lowest level since January
ITB
Berkshire Reshapes Its Stock Portfolio: ETFs in Focus
Berkshire Reshapes Its Stock Portfolio: ETFs in Focus
ITB
Should You Invest in the iShares U.S. Home Construction ETF (ITB)?
Should You Invest in the iShares U.S. Home Construction ETF (ITB)?
ITB
NAIL Is a Coiled Spring on the Housing Recovery. Here's the Catch
NAIL Is a Coiled Spring on the Housing Recovery. Here's the Catch
ITB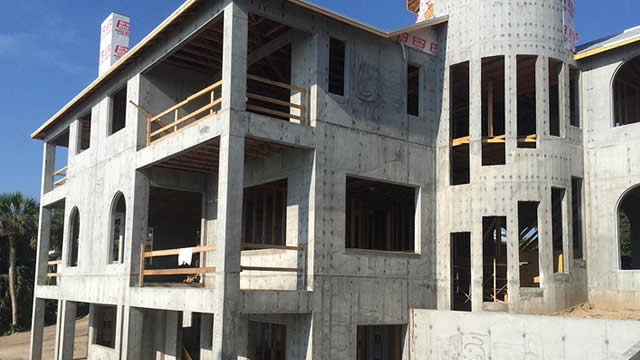
Landmark Housing Affordability Bill Becomes Law: ETFs in Focus
Landmark Housing Affordability Bill Becomes Law: ETFs in Focus
ITBNews tone: automated (AI) classification of the article's content, not a price prediction.
About iShares US Home Construction ETF
The iShares U.S. Home Construction ETF seeks to track the investment results of an index composed of U.S. equities in the home construction sector.
Fundamentals
Trading
Dividend
Source: third-party data provider, as of November 13, 2026
Technical indicators
- RSI 14
- 55.29
- MACD 12/26/9
- 2.43
- EMA 9 of MACD
- 1.89
- MACD histogram
- 0.53
- SMA 50
- $89.83
- Price above SMA 50
- EMA 50
- $91.92
- Price above EMA 50
- SMA 200
- $95.70
- Price below SMA 200
- EMA 200
- $95.20
- Price above EMA 200
Calculated by Gotrade from daily closing prices, as of November 11, 2026. Technical data, not a recommendation.
Analyst views
No analyst data available
Seasonality
Monthly price change (%)| Jan | Feb | Mar | Apr | May | Jun | Jul | Aug | Sep | Oct | Nov | Dec | |
|---|---|---|---|---|---|---|---|---|---|---|---|---|
| 2021 | -0.9 | +9.0 | ||||||||||
| 2022 | -12.5 | -5.7 | -10.8 | -3.6 | +2.7 | -12.1 | +11.4 | -9.0 | -6.7 | +3.9 | +8.5 | -1.8 |
| 2023 | +13.2 | -4.7 | +5.1 | +7.5 | -2.7 | +15.2 | +4.5 | -3.4 | -10.3 | -5.4 | +14.2 | +13.6 |
| 2024 | -0.5 | +5.5 | +5.6 | -8.9 | +2.0 | -4.0 | +22.4 | +2.6 | +8.0 | -8.1 | +5.7 | -16.2 |
| 2025 | +5.1 | -5.4 | -2.0 | -3.3 | -2.6 | +5.3 | +0.3 | +10.7 | -2.7 | -7.1 | +5.3 | -7.1 |
| 2026 | +4.7 | +4.7 | -13.7 | +5.9 | -1.9 | +12.3 | -7.6 | -2.4 | -5.8 | +6.1 | -1.6 |
Corporate actions
Upcoming
No upcoming corporate actions for ITB










