
iShares Core S&P 500 ETF (IVV) Stock
Key stats
- Market cap
- $316.40B
- Volume
- Loading
- 52-week high
- $785.03
- 52-week low
- $632.14
Source: third-party data provider, as of November 10, 2026
Recent news
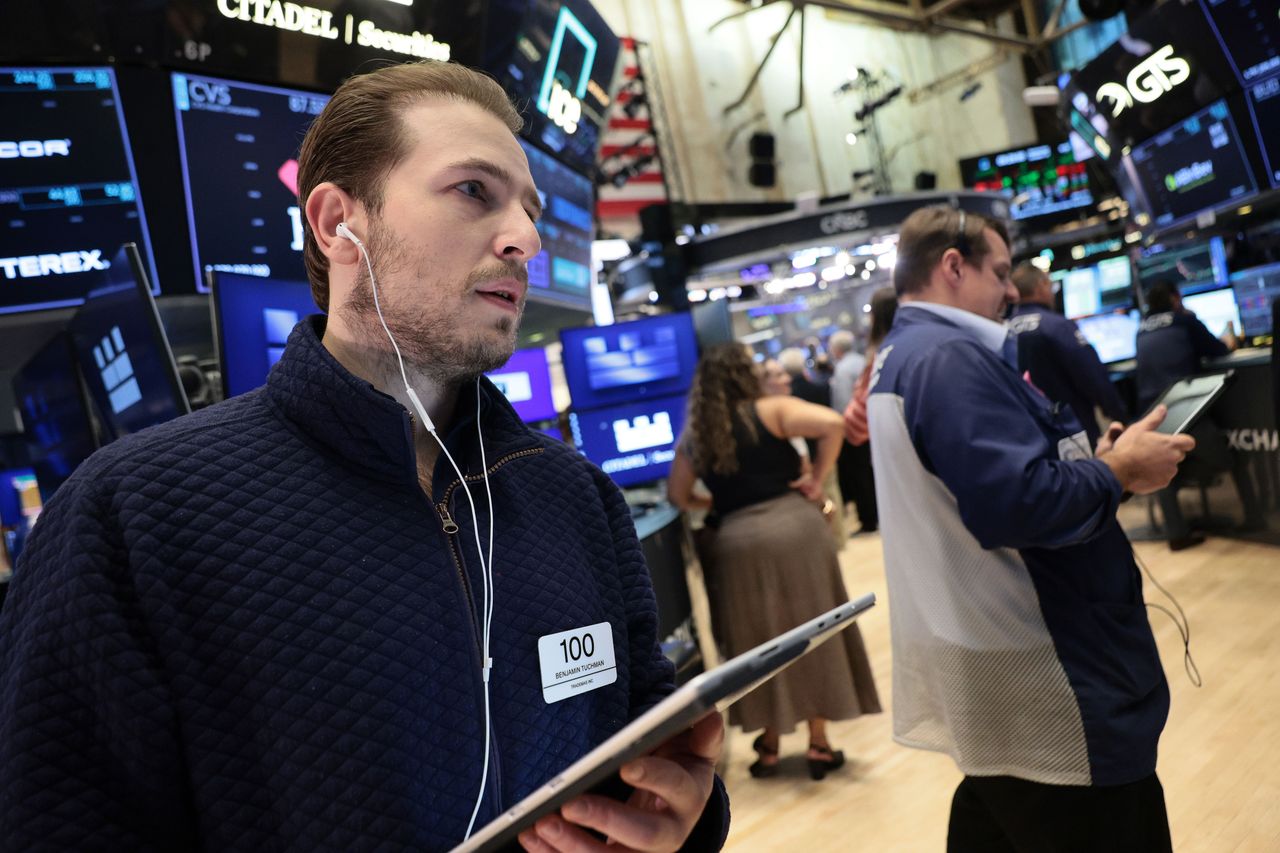
S&P 500, Nasdaq Surge Ahead After Democratic Sweep, Dow Jumps To One-Year High On Lower Oil — AAPL, SNAP, INTC, CRWV, QCOM In Focus
S&P 500, Nasdaq Surge Ahead After Democratic Sweep, Dow Jumps To One-Year High On Lower Oil — AAPL, SNAP, INTC, CRWV, QCOM In Focus
IVV
The S&P 500 Fell in Both September and October for Only the 17th Time Since 1950. Here's What Usually Followed.
The S&P 500 Fell in Both September and October for Only the 17th Time Since 1950. Here's What Usually Followed.
IVV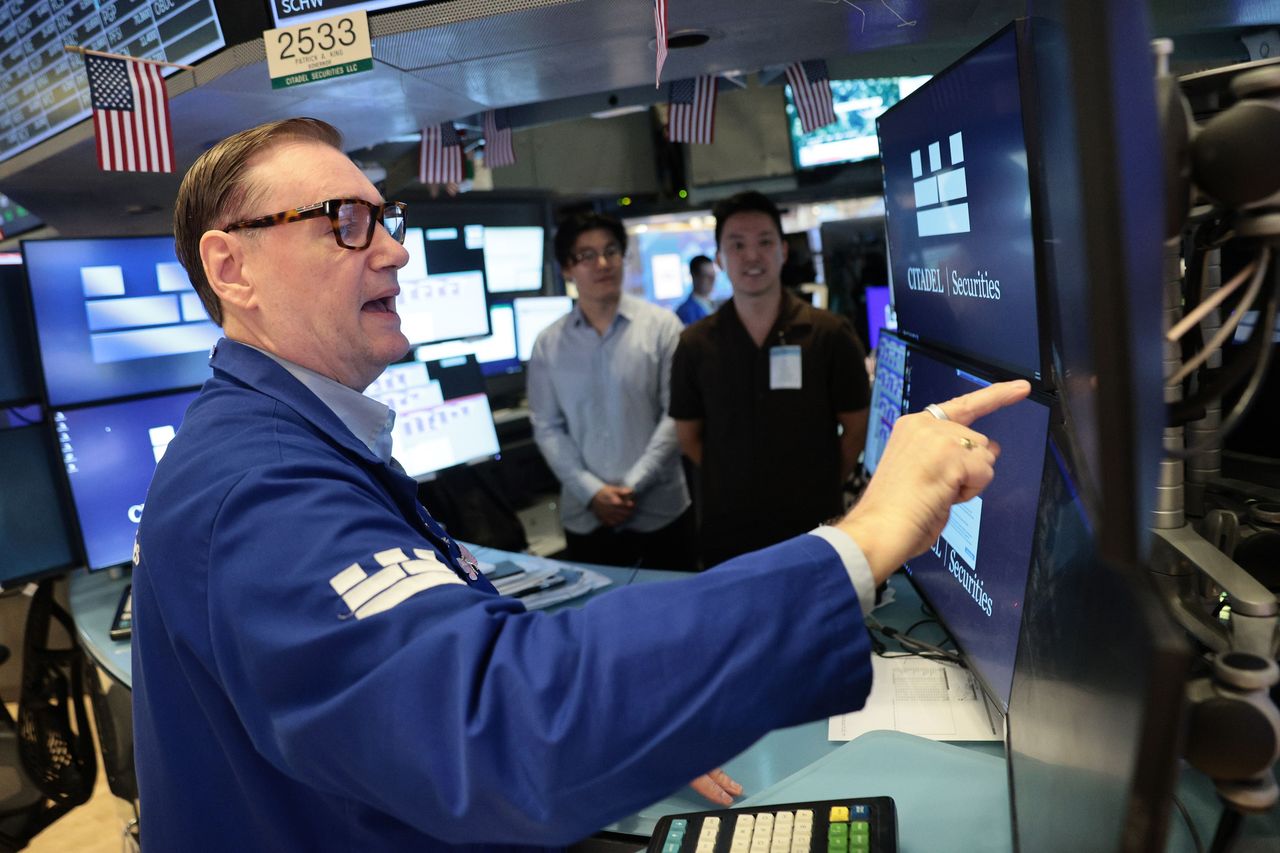
S&P 500, Nasdaq Recover From AI Rout On US Midterm Election Day — META, AAPL, AMD, SKHY In Focus
S&P 500, Nasdaq Recover From AI Rout On US Midterm Election Day — META, AAPL, AMD, SKHY In Focus
IVV
This Index Just Did Something It Hasn't Done Since 2009. Is It Time To Buy?
This Index Just Did Something It Hasn't Done Since 2009. Is It Time To Buy?
IVVNews tone: automated (AI) classification of the article's content, not a price prediction.
Technical indicators
- RSI 14
- 35.25
- MACD 12/26/9
- -6.07
- EMA 9 of MACD
- -2.63
- MACD histogram
- -3.44
- SMA 50
- $769.02
- Price below SMA 50
- EMA 50
- $766.02
- Price below EMA 50
- SMA 200
- $733.62
- Price above SMA 200
- EMA 200
- $734.66
- Price above EMA 200
Calculated by Gotrade from daily closing prices, as of November 6, 2026. Technical data, not a recommendation.
Analyst ratings
No analyst data available
Financials
Performance
No data available
Debt & Balance Sheet
No data available
Revenue to Profit
No data available
Earnings
No data available
Source: third-party data provider
Latest news
S&P 500, Nasdaq Surge Ahead After Democratic Sweep, Dow Jumps To One-Year High On Lower Oil — AAPL, SNAP, INTC, CRWV, QCOM In Focus
S&P 500, Nasdaq Surge Ahead After Democratic Sweep, Dow Jumps To One-Year High On Lower Oil — AAPL, SNAP, INTC, CRWV, QCOM In Focus
IVVThe S&P 500 Fell in Both September and October for Only the 17th Time Since 1950. Here's What Usually Followed.
The S&P 500 Fell in Both September and October for Only the 17th Time Since 1950. Here's What Usually Followed.
IVVS&P 500, Nasdaq Recover From AI Rout On US Midterm Election Day — META, AAPL, AMD, SKHY In Focus
S&P 500, Nasdaq Recover From AI Rout On US Midterm Election Day — META, AAPL, AMD, SKHY In Focus
IVVThis Index Just Did Something It Hasn't Done Since 2009. Is It Time To Buy?
This Index Just Did Something It Hasn't Done Since 2009. Is It Time To Buy?
IVV
The S&P 500's Record Profits Are Hiding a Problem Investors Haven't Seen Before
The S&P 500's Record Profits Are Hiding a Problem Investors Haven't Seen Before
IVV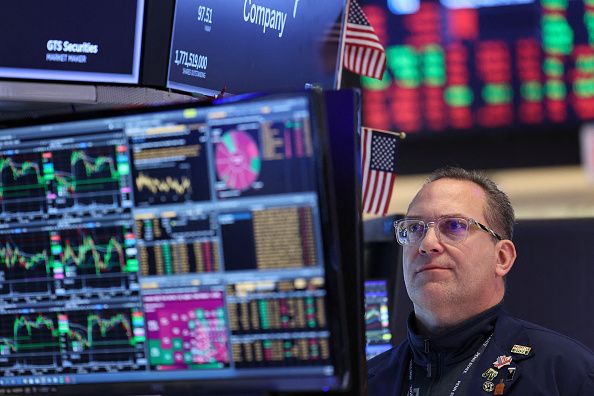
S&P 500, Nasdaq Drop As Capex Concerns Grip Tech Investors, Outweighing US-Iran Diplomacy Hope — ORCL, META, PLTR, AAPL In Focus
S&P 500, Nasdaq Drop As Capex Concerns Grip Tech Investors, Outweighing US-Iran Diplomacy Hope — ORCL, META, PLTR, AAPL In Focus
IVV
Ed Yardeni Is Sticking to his Year-End Call of 7,900 for the S&P 500
Ed Yardeni Is Sticking to his Year-End Call of 7,900 for the S&P 500
IVV
Stock market after midterm elections: What S&P 500 history shows
Stock market after midterm elections: What S&P 500 history shows
IVV
The S&P 500's Shiller P/E Is Above 40. History Says What Happened the Only Other Time.
The S&P 500's Shiller P/E Is Above 40. History Says What Happened the Only Other Time.
IVV
S&P 500 just flashed a signal warning of a major correction ahead
S&P 500 just flashed a signal warning of a major correction ahead
IVVNews tone: automated (AI) classification of the article's content, not a price prediction.
About iShares Core S&P 500 ETF
The iShares Core S&P 500 ETF seeks to track the investment results of an index composed of large-capitalization U.S. equities.
Fundamentals
Trading
Dividend
Source: third-party data provider, as of November 10, 2026
Technical indicators
- RSI 14
- 35.25
- MACD 12/26/9
- -6.07
- EMA 9 of MACD
- -2.63
- MACD histogram
- -3.44
- SMA 50
- $769.02
- Price below SMA 50
- EMA 50
- $766.02
- Price below EMA 50
- SMA 200
- $733.62
- Price above SMA 200
- EMA 200
- $734.66
- Price above EMA 200
Calculated by Gotrade from daily closing prices, as of November 6, 2026. Technical data, not a recommendation.
Analyst views
No analyst data available
Seasonality
Monthly price change (%)| Jan | Feb | Mar | Apr | May | Jun | Jul | Aug | Sep | Oct | Nov | Dec | |
|---|---|---|---|---|---|---|---|---|---|---|---|---|
| 2021 | -1.7 | +5.5 | ||||||||||
| 2022 | -5.8 | -3.6 | +5.0 | -9.1 | -0.3 | -7.9 | +8.1 | -3.8 | -10.0 | +5.3 | +6.0 | -6.1 |
| 2023 | +6.7 | -3.6 | +3.7 | +1.2 | +0.5 | +5.2 | +3.1 | -1.4 | -5.3 | -2.2 | +8.0 | +3.6 |
| 2024 | +2.2 | +3.8 | +2.0 | -3.9 | +5.4 | +3.2 | +0.9 | +3.8 | +3.9 | -0.0 | +5.5 | -3.0 |
| 2025 | +2.9 | -0.6 | -4.2 | -1.0 | +5.5 | +4.2 | +2.3 | +3.8 | +4.0 | +2.0 | +0.0 | +0.2 |
| 2026 | +1.3 | -1.3 | -5.3 | +9.7 | +5.0 | -1.7 | +0.2 | +1.2 | +0.1 | -1.1 | -2.2 |
Corporate actions
Upcoming
No upcoming corporate actions for IVV










