Kinder Morgan (KMI) Stock
Key stats
- Market cap
- $69.48B
- Price / Earnings ratio
- 18.9x
- EPS (TTM)
- $1.62
- Volume
- Loading
- 52-week high
- $34.81
- 52-week low
- $26.24
- Dividend yield
- 3.80%
- Dividend amount (latest)
- $0.30
- EPS vs analyst estimate
- 0.0%Q3 FY25 · $0.29 vs $0.29
Source: third-party data provider, as of November 11, 2026
EPS estimate: analyst consensus
Compare with KMI
Recent news

Realty Income and 4 More High-Yield Dividend Stocks for November
Realty Income and 4 More High-Yield Dividend Stocks for November
KMI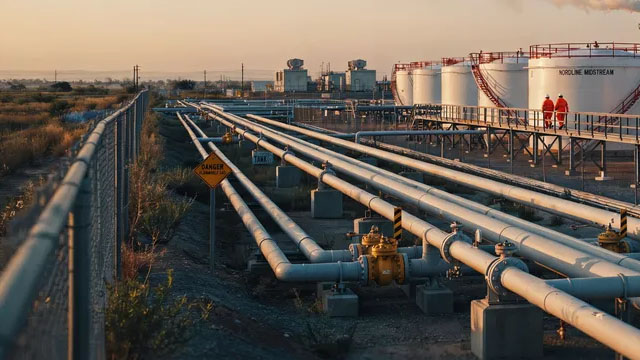
ONEOK Yields 4.4%, Kinder Morgan 3.4%. Which Is the Better Dividend Stock?
ONEOK Yields 4.4%, Kinder Morgan 3.4%. Which Is the Better Dividend Stock?
KMI
KMI Q3 Earnings Call Highlights Record Pipeline Backlog Growth
KMI Q3 Earnings Call Highlights Record Pipeline Backlog Growth
KMI
These Dividend Stocks Look Safe Until You See Their Capital Spending Plans
These Dividend Stocks Look Safe Until You See Their Capital Spending Plans
KMINews tone: automated (AI) classification of the article's content, not a price prediction.
Technical indicators
- RSI 14
- 42.41
- MACD 12/26/9
- -0.39
- EMA 9 of MACD
- 0.03
- MACD histogram
- -0.42
- SMA 50
- $32.03
- Price below SMA 50
- EMA 50
- $32.20
- Price below EMA 50
- SMA 200
- $32.17
- Price below SMA 200
- EMA 200
- $31.41
- Price below EMA 200
Calculated by Gotrade from daily closing prices, as of November 10, 2026. Technical data, not a recommendation.
Analyst ratings
Analyst consensus: Hold
Based on 11 analyst ratings
Third-party analyst opinion, not a recommendation from Gotrade.
Financials
Performance
Debt & Balance Sheet
Revenue to Profit
2025Earnings
The market is expecting earnings per share of $0.31 for this quarter. The company has not yet shared when it is announcing earnings.
Source: third-party data provider
Latest news
Realty Income and 4 More High-Yield Dividend Stocks for November
Realty Income and 4 More High-Yield Dividend Stocks for November
KMIONEOK Yields 4.4%, Kinder Morgan 3.4%. Which Is the Better Dividend Stock?
ONEOK Yields 4.4%, Kinder Morgan 3.4%. Which Is the Better Dividend Stock?
KMIKMI Q3 Earnings Call Highlights Record Pipeline Backlog Growth
KMI Q3 Earnings Call Highlights Record Pipeline Backlog Growth
KMIThese Dividend Stocks Look Safe Until You See Their Capital Spending Plans
These Dividend Stocks Look Safe Until You See Their Capital Spending Plans
KMI
Is Kinder Morgan (KMI) a Buy as Wall Street Analysts Look Optimistic?
Is Kinder Morgan (KMI) a Buy as Wall Street Analysts Look Optimistic?
KMI
Kinder Morgan: 1 Number From Q3 Earnings Every Investor Should See
Kinder Morgan: 1 Number From Q3 Earnings Every Investor Should See
KMI
Kinder Morgan: 3 Key Takeaways for Long-Term Investors
Kinder Morgan: 3 Key Takeaways for Long-Term Investors
KMI
Is Trending Stock Kinder Morgan, Inc. (KMI) a Buy Now?
Is Trending Stock Kinder Morgan, Inc. (KMI) a Buy Now?
KMI
4 of the Highest Yields in the S&P 500 That Are Actually Covered
4 of the Highest Yields in the S&P 500 That Are Actually Covered
KMI
Energy Transfer vs. Kinder Morgan: Which Natural Gas Pipeline Stock Is the Better Buy for the AI Power Boom?
Energy Transfer vs. Kinder Morgan: Which Natural Gas Pipeline Stock Is the Better Buy for the AI Power Boom?
KMINews tone: automated (AI) classification of the article's content, not a price prediction.
About Kinder Morgan
Kinder Morgan, Inc. is one of the largest energy infrastructure companies in North America. Access to reliable, affordable energy is a critical component for improving lives around the world. We are committed to providing energy transportation and storage services in a safe, efficient and environmentally responsible manner for the benefit of people, communities and businesses we serve. We own an interest in or operate approximately 83,000 miles of pipelines and 144 terminals. Our pipelines transport natural gas, refined petroleum products, crude oil, condensate, CO2 and other products, and our terminals store and handle various commodities including gasoline, diesel, jet fuel, chemicals, ethanol, metals and petroleum coke.
Key Executives
| Name | Title | Year Born |
|---|---|---|
| Ms. Kimberly Allen Dang | CEO & Director | 1970 |
| Mr. Richard D. Kinder | Executive Chairman of the Board | 1945 |
| Mr. David Patrick Michels | VP & CFO | 1979 |
| Mr. Kenneth W. Grubb | VP, COO & Chief Project Officer | 1968 |
| Mr. Dax A. Sanders CPA | President | 1975 |
| Mr. John W. Schlosser | VP & President of Terminals | 1963 |
| Mr. Sital K. Mody | VP & President of Natural Gas Pipelines | 1971 |
| Mr. Mark Huse | VP & Chief Information Officer | — |
| Mr. Michael J. Pitta | VP & Chief Administrative Officer | 1974 |
| Mr. Peter Staples | Director of IR | — |
Fundamentals
Valuation
Profitability
Trading
Dividend
Source: third-party data provider, as of November 11, 2026
Technical indicators
- RSI 14
- 42.41
- MACD 12/26/9
- -0.39
- EMA 9 of MACD
- 0.03
- MACD histogram
- -0.42
- SMA 50
- $32.03
- Price below SMA 50
- EMA 50
- $32.20
- Price below EMA 50
- SMA 200
- $32.17
- Price below SMA 200
- EMA 200
- $31.41
- Price below EMA 200
Calculated by Gotrade from daily closing prices, as of November 10, 2026. Technical data, not a recommendation.
Analyst views
11 analyst ratings
Third-party analyst opinion, not a recommendation from Gotrade.
- Low
- $34.00
- Average
- $37.64
- High
- $40.00
Seasonality
Monthly price change (%)| Jan | Feb | Mar | Apr | May | Jun | Jul | Aug | Sep | Oct | Nov | Dec | |
|---|---|---|---|---|---|---|---|---|---|---|---|---|
| 2021 | -7.3 | +3.9 | ||||||||||
| 2022 | +6.2 | -0.1 | +7.5 | -5.6 | +8.3 | -16.3 | +5.9 | +2.3 | -8.4 | +6.0 | +4.8 | -5.6 |
| 2023 | +1.6 | -7.1 | +1.4 | -2.9 | -5.8 | +5.9 | +2.7 | -1.9 | -3.3 | +0.2 | +7.5 | -0.6 |
| 2024 | -5.1 | +2.1 | +5.0 | -0.7 | +6.9 | +1.9 | +6.8 | +2.4 | +2.5 | +8.5 | +16.9 | -0.1 |
| 2025 | -2.2 | -1.7 | +5.1 | -8.1 | +6.6 | +2.6 | -1.0 | -4.0 | +5.9 | -7.5 | +4.8 | +0.7 |
| 2026 | +10.0 | +12.4 | -1.1 | -0.0 | -4.5 | +3.6 | +1.5 | +2.7 | -6.1 | +10.9 | -6.5 |