
iShares MSCI Saudi Arabia ETF (KSA) Stock
Key stats
- Market cap
- $1.15B
- Volume
- Loading
- 52-week high
- $40.83
- 52-week low
- $33.60
Source: third-party data provider, as of November 13, 2026
Recent news

US Orders Some Diplomats Out of Saudi Arabia After Deadly Attacks, Brent Tops $110
US Orders Some Diplomats Out of Saudi Arabia After Deadly Attacks, Brent Tops $110
KSA
Reasonable decision for Saudi Arabia to postpone investor conference: S&P Global's Yergin
Reasonable decision for Saudi Arabia to postpone investor conference: S&P Global's Yergin
KSA
Saudi energy minister says oil pumped through East-West pipeline reached 5.8 million barrels
Saudi energy minister says oil pumped through East-West pipeline reached 5.8 million barrels
KSA
U.S. approves potential sale of Joint Direct Attack Munitions-Extend Range to Saudi Arabia for $5 billion
U.S. approves potential sale of Joint Direct Attack Munitions-Extend Range to Saudi Arabia for $5 billion
KSANews tone: automated (AI) classification of the article's content, not a price prediction.
Technical indicators
- RSI 14
- 60.46
- MACD 12/26/9
- -0.15
- EMA 9 of MACD
- -0.42
- MACD histogram
- 0.27
- SMA 50
- $36.15
- Price below SMA 50
- EMA 50
- $35.87
- Price above EMA 50
- SMA 200
- $37.82
- Price below SMA 200
- EMA 200
- $37.30
- Price below EMA 200
Calculated by Gotrade from daily closing prices, as of November 11, 2026. Technical data, not a recommendation.
Analyst ratings
No analyst data available
Financials
Performance
No data available
Debt & Balance Sheet
No data available
Revenue to Profit
No data available
Earnings
No data available
Source: third-party data provider
Latest news
US Orders Some Diplomats Out of Saudi Arabia After Deadly Attacks, Brent Tops $110
US Orders Some Diplomats Out of Saudi Arabia After Deadly Attacks, Brent Tops $110
KSAReasonable decision for Saudi Arabia to postpone investor conference: S&P Global's Yergin
Reasonable decision for Saudi Arabia to postpone investor conference: S&P Global's Yergin
KSASaudi energy minister says oil pumped through East-West pipeline reached 5.8 million barrels
Saudi energy minister says oil pumped through East-West pipeline reached 5.8 million barrels
KSAU.S. approves potential sale of Joint Direct Attack Munitions-Extend Range to Saudi Arabia for $5 billion
U.S. approves potential sale of Joint Direct Attack Munitions-Extend Range to Saudi Arabia for $5 billion
KSA
As war strands Qatari gas for 6 months, US sales rise and European stocks plummet
As war strands Qatari gas for 6 months, US sales rise and European stocks plummet
KSA
Most Gulf bourses gain despite stalled Iran talks, Hormuz disruption
Most Gulf bourses gain despite stalled Iran talks, Hormuz disruption
KSA
Saudi Arabia considers expansion of oil pipeline to Red Sea, sources say
Saudi Arabia considers expansion of oil pipeline to Red Sea, sources say
KSA
Saudi Aramco ramps up exports from Ras Tanura, switches to spot sales, sources say
Saudi Aramco ramps up exports from Ras Tanura, switches to spot sales, sources say
KSA
Saudi-backed Riyadh Air wins approval to operate US flights
Saudi-backed Riyadh Air wins approval to operate US flights
KSA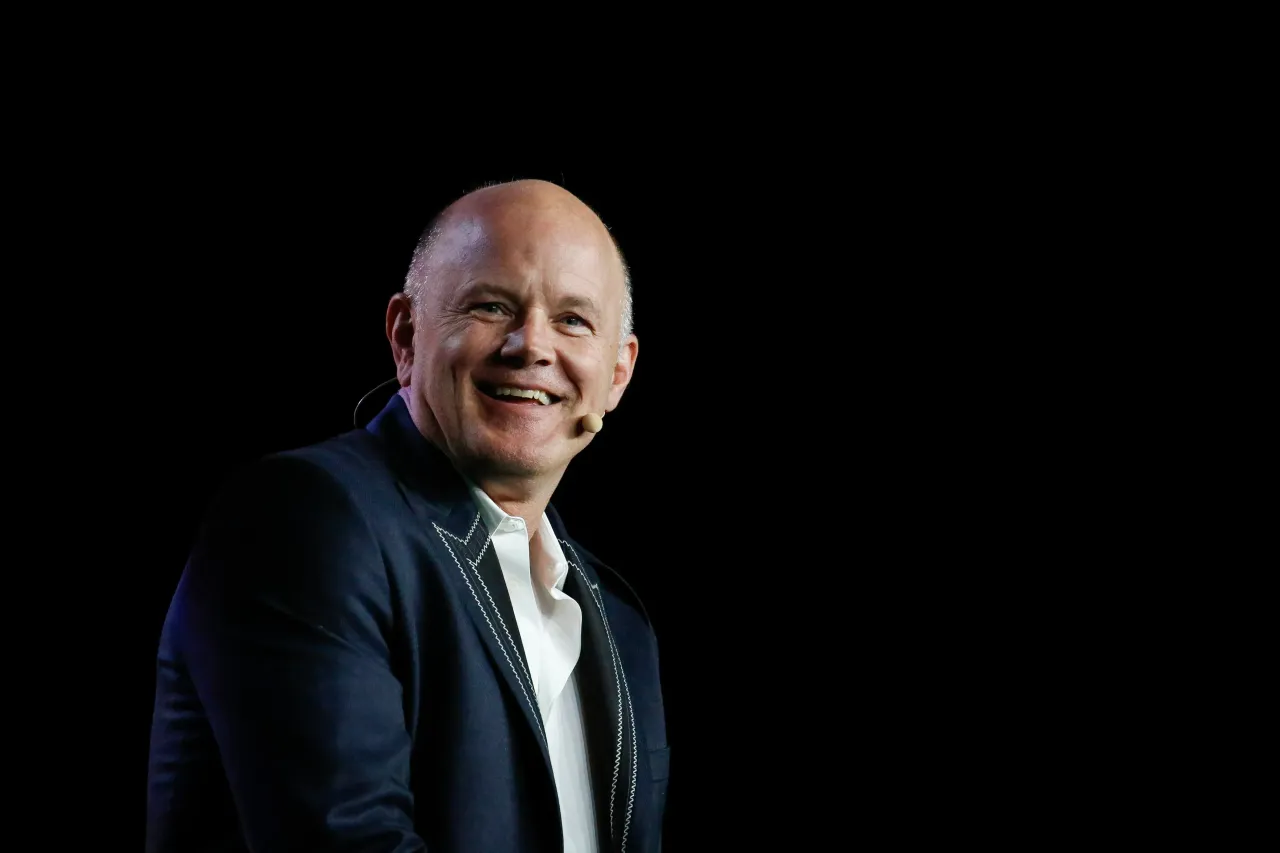
Galaxy-CEO Mike Novogratz Calls SpaceX 'Biggest IPO By A Factor Of Three' But Warns Of 'Palm' Bubble Echo
Galaxy-CEO Mike Novogratz Calls SpaceX 'Biggest IPO By A Factor Of Three' But Warns Of 'Palm' Bubble Echo
KSANews tone: automated (AI) classification of the article's content, not a price prediction.
About iShares MSCI Saudi Arabia ETF
The iShares MSCI Saudi Arabia ETF seeks to track the investment results of a broad-based index composed of Saudi equities.
Fundamentals
Trading
Dividend
Source: third-party data provider, as of November 13, 2026
Technical indicators
- RSI 14
- 60.46
- MACD 12/26/9
- -0.15
- EMA 9 of MACD
- -0.42
- MACD histogram
- 0.27
- SMA 50
- $36.15
- Price below SMA 50
- EMA 50
- $35.87
- Price above EMA 50
- SMA 200
- $37.82
- Price below SMA 200
- EMA 200
- $37.30
- Price below EMA 200
Calculated by Gotrade from daily closing prices, as of November 11, 2026. Technical data, not a recommendation.
Analyst views
No analyst data available
Seasonality
Monthly price change (%)| Jan | Feb | Mar | Apr | May | Jun | Jul | Aug | Sep | Oct | Nov | Dec | |
|---|---|---|---|---|---|---|---|---|---|---|---|---|
| 2021 | -10.0 | +3.5 | ||||||||||
| 2022 | +10.1 | +3.1 | +1.5 | +5.9 | -7.8 | -9.9 | +6.2 | +0.1 | -7.0 | +1.1 | -6.4 | -3.5 |
| 2023 | +2.0 | -7.0 | +5.3 | +4.0 | -2.4 | +2.0 | +1.8 | -1.7 | -5.4 | -2.4 | +2.6 | +6.7 |
| 2024 | -3.2 | +5.4 | -1.5 | -1.0 | -6.7 | -0.5 | +4.1 | +2.4 | +1.4 | -0.4 | -2.3 | -0.4 |
| 2025 | +3.2 | -2.5 | +0.7 | -2.2 | -4.2 | +1.0 | -1.8 | +0.1 | +9.1 | +0.1 | -6.4 | -1.8 |
| 2026 | +8.4 | -6.6 | +8.7 | -1.2 | -1.4 | -2.0 | -1.8 | +3.0 | -6.0 | -5.2 | +5.1 |
Corporate actions
Upcoming
No upcoming corporate actions for KSA










