
Intuitive Machines, Inc. Class A Common Stock (LUNR) Stock
Key stats
- Market cap
- $1.87B
- Price / Earnings ratio
- -19.2x
- EPS (TTM)
- -$0.95
- Volume
- Loading
- 52-week high
- $46.75
- 52-week low
- $7.78
Source: third-party data provider, as of October 17, 2026
Compare with LUNR
Recent news

Firefly Aerospace vs. Intuitive Machines: Which Space Infrastructure Stock Is a Better Buy in 2026?
Firefly Aerospace vs. Intuitive Machines: Which Space Infrastructure Stock Is a Better Buy in 2026?
LUNR
SpaceX Drops 4% on Agreement to Testify in New York City AI Safety Probe; Intuitive Machines Sinks 6%, Virgin Galactic Holdings Slips
SpaceX Drops 4% on Agreement to Testify in New York City AI Safety Probe; Intuitive Machines Sinks 6%, Virgin Galactic Holdings Slips
LUNR
AST SpaceMobile vs. Intuitive Machines: Which Space Stock Is a Better Buy in 2026?
AST SpaceMobile vs. Intuitive Machines: Which Space Stock Is a Better Buy in 2026?
LUNR
Intuitive Machines vs. Redwire: Which Space Race Stock Is a Better Buy in 2026?
Intuitive Machines vs. Redwire: Which Space Race Stock Is a Better Buy in 2026?
LUNRNews tone: automated (AI) classification of the article's content, not a price prediction.
Technical indicators
- RSI 14
- 34.08
- MACD 12/26/9
- -0.89
- EMA 9 of MACD
- -0.58
- MACD histogram
- -0.32
- SMA 50
- $15.33
- Price below SMA 50
- EMA 50
- $15.13
- Price below EMA 50
- SMA 200
- $20.17
- Price below SMA 200
- EMA 200
- $17.53
- Price below EMA 200
Calculated by Gotrade from daily closing prices, as of October 15, 2026. Technical data, not a recommendation.
Analyst ratings
Analyst consensus: Buy
Based on 5 analyst ratings
Third-party analyst opinion, not a recommendation from Gotrade.
Financials
Performance
Debt & Balance Sheet
Revenue to Profit
2025Earnings
No data available
Source: third-party data provider
Latest news
Firefly Aerospace vs. Intuitive Machines: Which Space Infrastructure Stock Is a Better Buy in 2026?
Firefly Aerospace vs. Intuitive Machines: Which Space Infrastructure Stock Is a Better Buy in 2026?
LUNRSpaceX Drops 4% on Agreement to Testify in New York City AI Safety Probe; Intuitive Machines Sinks 6%, Virgin Galactic Holdings Slips
SpaceX Drops 4% on Agreement to Testify in New York City AI Safety Probe; Intuitive Machines Sinks 6%, Virgin Galactic Holdings Slips
LUNRAST SpaceMobile vs. Intuitive Machines: Which Space Stock Is a Better Buy in 2026?
AST SpaceMobile vs. Intuitive Machines: Which Space Stock Is a Better Buy in 2026?
LUNRIntuitive Machines vs. Redwire: Which Space Race Stock Is a Better Buy in 2026?
Intuitive Machines vs. Redwire: Which Space Race Stock Is a Better Buy in 2026?
LUNR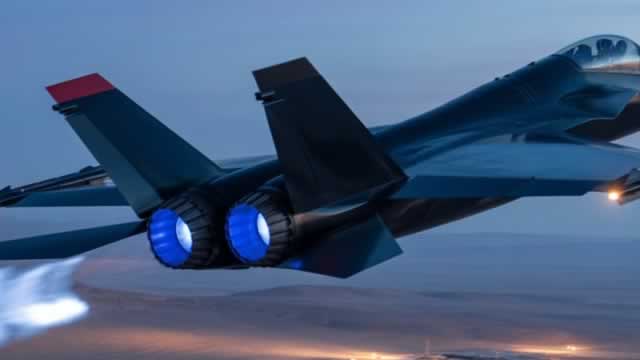
The Real Moon Trade Isn't Who Gets There First — It's Who Keeps the Base Running
The Real Moon Trade Isn't Who Gets There First — It's Who Keeps the Base Running
LUNR
Prediction: 2 Space Stocks That Could Join SpaceX and Rocket Lab in the Nasdaq-100 by 2030
Prediction: 2 Space Stocks That Could Join SpaceX and Rocket Lab in the Nasdaq-100 by 2030
LUNR
Intuitive Machines vs. Rocket Lab: Which Space Stock Can Send Your Returns Into Orbit in 2026?
Intuitive Machines vs. Rocket Lab: Which Space Stock Can Send Your Returns Into Orbit in 2026?
LUNR
Intuitive Machines vs. Virgin Galactic: Which Has More Potential?
Intuitive Machines vs. Virgin Galactic: Which Has More Potential?
LUNR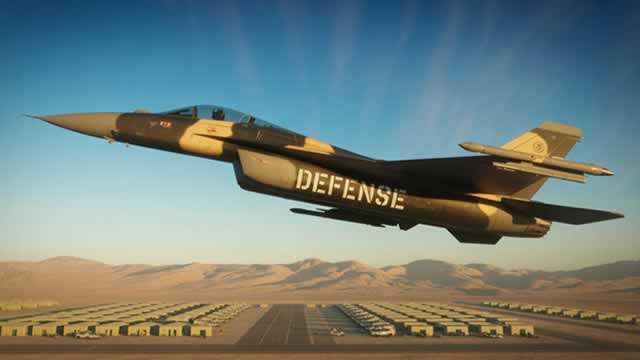
Is LUNR Building a Full-Service Space Infrastructure Platform?
Is LUNR Building a Full-Service Space Infrastructure Platform?
LUNR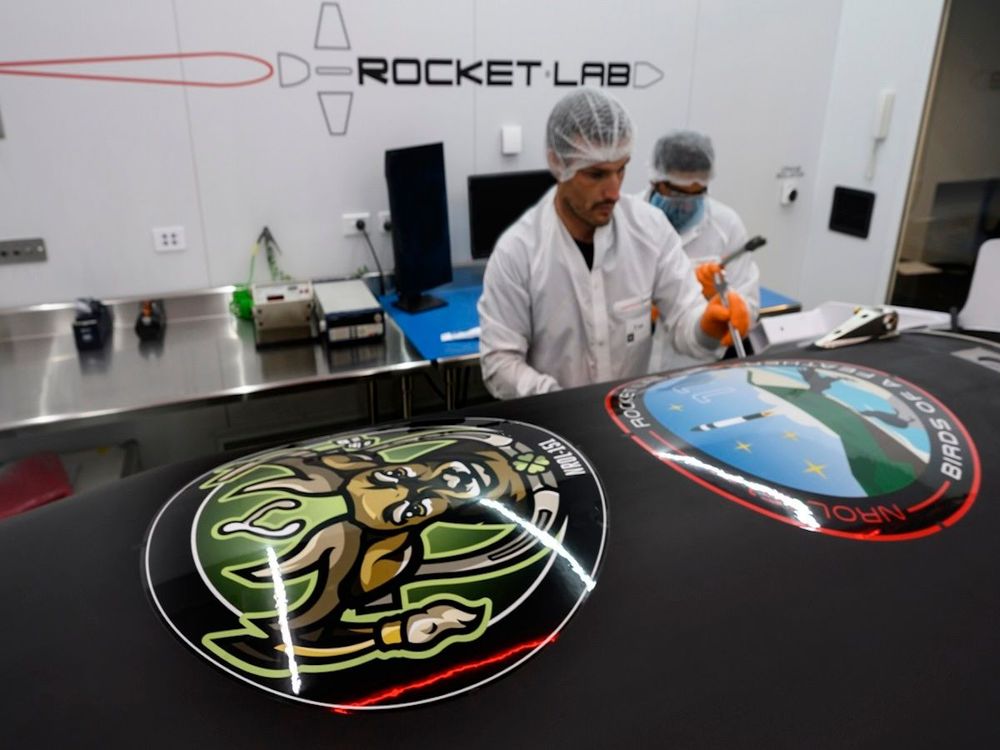
Cantor Backs Rocket Lab’s Launch Momentum After 97th Electron Mission – Highlights These ‘Competitive Advantages’
Cantor Backs Rocket Lab’s Launch Momentum After 97th Electron Mission – Highlights These ‘Competitive Advantages’
LUNRNews tone: automated (AI) classification of the article's content, not a price prediction.
About Intuitive Machines, Inc. Class A Common Stock
No description available.
Key Executives
| Name | Title | Year Born |
|---|---|---|
| Mr. Stephen J. Altemus | Co-Founder, President, CEO & Director | 1964 |
| Dr. Kamal Seyed Ghaffarian Ph.D. | Co-Founder & Chairman | 1959 |
| Mr. Peter McGrath II | Senior VP & CFO | 1968 |
| Dr. Timothy P. Crain | Co- Founder, Senior VP & CTO | 1973 |
| Mr. Steven Vontur | Chief Accounting Officer & Controller | — |
| Dr. Ben Bussey | Chief Scientist | — |
| Ms. Anna Chiara Jones | Senior VP, General Counsel & Corporate Secretary | 1980 |
| Ms. Jade Marcantel | Chief Human Capital Officer | — |
| Mr. Jack Fischer | Senior VP & Chief Integration Officer | — |
| Mr. James J. Frelk | Senior Vice President of Data Services | 1961 |
Fundamentals
Valuation
Profitability
Trading
Source: third-party data provider, as of October 17, 2026
Technical indicators
- RSI 14
- 34.08
- MACD 12/26/9
- -0.89
- EMA 9 of MACD
- -0.58
- MACD histogram
- -0.32
- SMA 50
- $15.33
- Price below SMA 50
- EMA 50
- $15.13
- Price below EMA 50
- SMA 200
- $20.17
- Price below SMA 200
- EMA 200
- $17.53
- Price below EMA 200
Calculated by Gotrade from daily closing prices, as of October 15, 2026. Technical data, not a recommendation.
Analyst views
5 analyst ratings
Third-party analyst opinion, not a recommendation from Gotrade.
- Low
- $13.00
- Average
- $30.60
- High
- $43.00
Seasonality
Monthly price change (%)| Jan | Feb | Mar | Apr | May | Jun | Jul | Aug | Sep | Oct | Nov | Dec | |
|---|---|---|---|---|---|---|---|---|---|---|---|---|
| 2023 | +100.4 | -44.0 | -26.5 | -6.2 | +11.9 | +4.8 | -41.3 | -25.4 | -24.3 | -4.7 | -12.9 | |
| 2024 | +60.2 | +63.4 | +6.8 | -23.9 | -2.9 | -33.2 | +14.0 | +31.5 | +54.8 | +3.0 | +101.6 | +24.7 |
| 2025 | +12.2 | -32.8 | -44.7 | +9.8 | +32.4 | -1.3 | +4.8 | -17.3 | +20.8 | +12.4 | -18.0 | +75.3 |
| 2026 | +6.2 | -7.6 | +3.2 | +25.2 | +71.1 | -44.0 | -38.9 | +17.3 | -3.3 | -17.7 |










