Marina Bay Sands (LVS) Stock
Key stats
- Market cap
- $26.02B
- Price / Earnings ratio
- 15.8x
- EPS (TTM)
- $2.44
- Volume
- Loading
- 52-week high
- $70.45
- 52-week low
- $35.03
- Dividend yield
- 2.99%
- Dividend amount (latest)
- $0.30
Source: third-party data provider, as of November 10, 2026
Compare with LVS
Recent news

LVS Q3 Earnings & Revenues Miss on Soft Premium Gaming & Higher Costs
LVS Q3 Earnings & Revenues Miss on Soft Premium Gaming & Higher Costs
LVS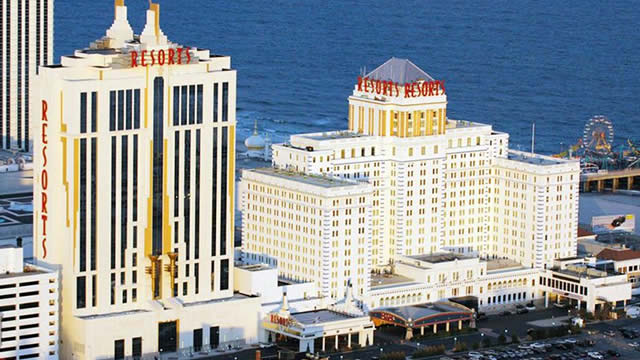
Las Vegas Sands: 3 Key Takeaways for Long-Term Investors
Las Vegas Sands: 3 Key Takeaways for Long-Term Investors
LVS
Las Vegas Sands (LVS) Q3 Earnings: Taking a Look at Key Metrics Versus Estimates
Las Vegas Sands (LVS) Q3 Earnings: Taking a Look at Key Metrics Versus Estimates
LVS
What Las Vegas Sands (LVS) Said on Its Q3 Earnings Call
What Las Vegas Sands (LVS) Said on Its Q3 Earnings Call
LVSNews tone: automated (AI) classification of the article's content, not a price prediction.
Technical indicators
- RSI 14
- 60.85
- MACD 12/26/9
- 0.37
- EMA 9 of MACD
- -0.24
- MACD histogram
- 0.61
- SMA 50
- $39.18
- Price above SMA 50
- EMA 50
- $39.63
- Price above EMA 50
- SMA 200
- $48.38
- Price below SMA 200
- EMA 200
- $48.54
- Price below EMA 200
Calculated by Gotrade from daily closing prices, as of November 9, 2026. Technical data, not a recommendation.
Analyst ratings
Analyst consensus: Buy
Based on 12 analyst ratings
Third-party analyst opinion, not a recommendation from Gotrade.
Financials
Performance
Debt & Balance Sheet
Revenue to Profit
2025Earnings
The market is expecting earnings per share of $0.79 for this quarter. The company has not yet shared when it is announcing earnings.
Source: third-party data provider
Latest news
LVS Q3 Earnings & Revenues Miss on Soft Premium Gaming & Higher Costs
LVS Q3 Earnings & Revenues Miss on Soft Premium Gaming & Higher Costs
LVSLas Vegas Sands: 3 Key Takeaways for Long-Term Investors
Las Vegas Sands: 3 Key Takeaways for Long-Term Investors
LVSLas Vegas Sands (LVS) Q3 Earnings: Taking a Look at Key Metrics Versus Estimates
Las Vegas Sands (LVS) Q3 Earnings: Taking a Look at Key Metrics Versus Estimates
LVSWhat Las Vegas Sands (LVS) Said on Its Q3 Earnings Call
What Las Vegas Sands (LVS) Said on Its Q3 Earnings Call
LVS
Las Vegas Sands (LVS) Q3 Earnings and Revenues Miss Estimates
Las Vegas Sands (LVS) Q3 Earnings and Revenues Miss Estimates
LVS
Las Vegas Sands to Report Q3 Earnings: Key Factors to Watch
Las Vegas Sands to Report Q3 Earnings: Key Factors to Watch
LVS
Seeking Clues to Las Vegas Sands (LVS) Q3 Earnings? A Peek Into Wall Street Projections for Key Metrics
Seeking Clues to Las Vegas Sands (LVS) Q3 Earnings? A Peek Into Wall Street Projections for Key Metrics
LVS
Crypto bosses, CEOs and F1: Singapore's business events boom gathers pace
Crypto bosses, CEOs and F1: Singapore's business events boom gathers pace
LVS
Did Promo Spending Actually Win Back Bettors for These 3 Gambling Stocks?
Did Promo Spending Actually Win Back Bettors for These 3 Gambling Stocks?
LVS
Las Vegas Sands or Wynn Resorts: Which Casino Dividend Is the Better Bet?
Las Vegas Sands or Wynn Resorts: Which Casino Dividend Is the Better Bet?
LVSNews tone: automated (AI) classification of the article's content, not a price prediction.
About Marina Bay Sands
Las Vegas Sands owns and operates some of the most famous resorts in the world. Our portfolio includes Marina Bay Sands, The Venetian, The Palazzo, The Plaza & The Parisian. Marina Bay Sands in Singapore is the leading business, leisure and entertainment destination in Asia. It features large and flexible convention and exhibition facilities, more than 2,500 hotel rooms and suites, the rooftop Sands SkyPark, and the best shopping mall in Asia, world-class celebrity chef restaurants, a theatre and an outdoor event plaza. Completing the line-up of attractions is ArtScience Museum at Marina Bay Sands which plays host to permanent and marquee exhibitions.
Key Executives
| Name | Title | Year Born |
|---|---|---|
| Mr. Patrick Dumont | Chairman, CEO, President & Treasurer | 1975 |
| Mr. Randy A. Hyzak | Executive VP & CFO | 1970 |
| Mr. D. Zachary Hudson J.D. | Executive VP, Global General Counsel & Secretary | 1980 |
| Mr. Robert Glen Goldstein | Senior Advisor | 1956 |
| Mr. Daniel J. Briggs | Senior Vice President of Investor Relations | — |
| Mr. Ronald Reese | Senior Vice President of Global Communications, Corporate Affairs & Public Relations | — |
Fundamentals
Valuation
Profitability
Trading
Dividend
Source: third-party data provider, as of November 10, 2026
Technical indicators
- RSI 14
- 60.85
- MACD 12/26/9
- 0.37
- EMA 9 of MACD
- -0.24
- MACD histogram
- 0.61
- SMA 50
- $39.18
- Price above SMA 50
- EMA 50
- $39.63
- Price above EMA 50
- SMA 200
- $48.38
- Price below SMA 200
- EMA 200
- $48.54
- Price below EMA 200
Calculated by Gotrade from daily closing prices, as of November 9, 2026. Technical data, not a recommendation.
Analyst views
12 analyst ratings
Third-party analyst opinion, not a recommendation from Gotrade.
- Low
- $37.00
- Average
- $48.27
- High
- $56.00
Seasonality
Monthly price change (%)| Jan | Feb | Mar | Apr | May | Jun | Jul | Aug | Sep | Oct | Nov | Dec | |
|---|---|---|---|---|---|---|---|---|---|---|---|---|
| 2021 | -9.8 | +10.8 | ||||||||||
| 2022 | +12.7 | -4.0 | -3.5 | -10.3 | -3.4 | -4.5 | +6.8 | -0.4 | +2.2 | -1.5 | +21.2 | +2.5 |
| 2023 | +19.6 | -2.5 | -1.9 | +8.7 | -15.0 | +4.6 | +2.1 | -7.4 | -16.5 | +3.9 | -1.3 | +5.1 |
| 2024 | -4.7 | +7.2 | +0.8 | -16.6 | +1.1 | -1.4 | -7.5 | +1.4 | +30.1 | +0.0 | +2.6 | -6.6 |
| 2025 | -8.2 | -0.5 | -15.0 | -6.3 | +11.8 | +5.8 | +10.6 | +10.3 | -5.6 | +8.4 | +10.4 | -6.3 |
| 2026 | -19.1 | +1.9 | -4.4 | +0.5 | -6.0 | -13.3 | +5.7 | -7.3 | -13.8 | +0.8 | +6.6 |