
Nokia (NOK) Stock
Key stats
- Market cap
- $52.12B
- Price / Earnings ratio
- 69.1x
- EPS (TTM)
- $0.14
- Volume
- Loading
- 52-week high
- $17.45
- 52-week low
- $5.86
- Dividend yield
- 1.36%
- Dividend amount (latest)
- $0.15
- EPS vs analyst estimate
- +16.7%Q3 FY25 · $0.07 vs $0.06
Source: third-party data provider, as of October 31, 2026
EPS estimate: analyst consensus
Compare with NOK
Recent news

ERIC vs. NOK: Which 5G Infrastructure Stock is the Better Buy Now?
ERIC vs. NOK: Which 5G Infrastructure Stock is the Better Buy Now?
NOK
Nokia Climbs 3% on Five-Year India R&D Deal; Ericsson Edges Higher
Nokia Climbs 3% on Five-Year India R&D Deal; Ericsson Edges Higher
NOK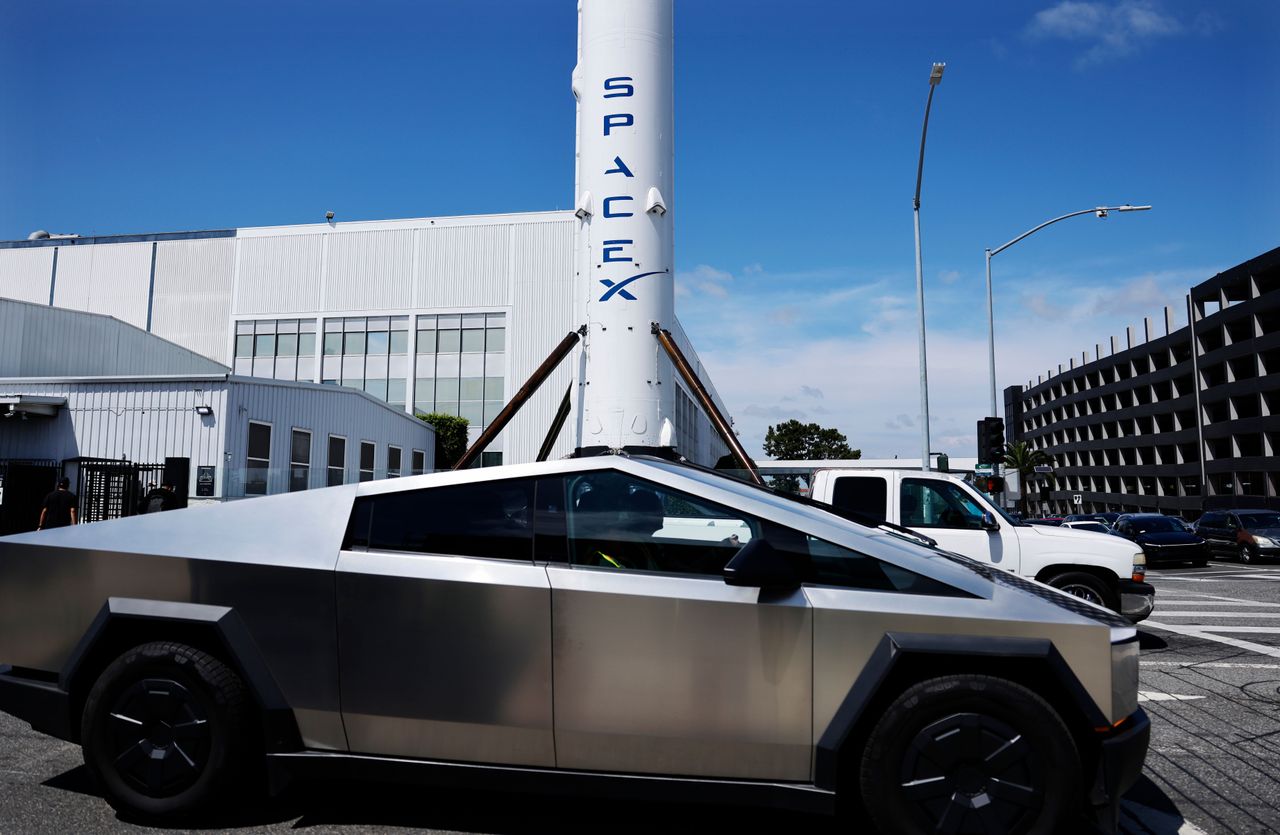
SPCX, SMCI, NOK, TSLA, NFLX: Why Retail Traders Couldn’t Take Their Eyes Off These Stocks Last Week
SPCX, SMCI, NOK, TSLA, NFLX: Why Retail Traders Couldn’t Take Their Eyes Off These Stocks Last Week
NOK
SpaceX’s 80,000 Cell Site Push A Win For AST SpaceMobile, Ericsson, Nokia, NextNav, Among Others, Says Roth Capital
SpaceX’s 80,000 Cell Site Push A Win For AST SpaceMobile, Ericsson, Nokia, NextNav, Among Others, Says Roth Capital
NOKNews tone: automated (AI) classification of the article's content, not a price prediction.
Technical indicators
- RSI 14
- 47.68
- MACD 12/26/9
- -0.38
- EMA 9 of MACD
- -0.38
- MACD histogram
- -0.00
- SMA 50
- $10.00
- Price below SMA 50
- EMA 50
- $9.89
- Price below EMA 50
- SMA 200
- $10.30
- Price below SMA 200
- EMA 200
- $9.61
- Price below EMA 200
Calculated by Gotrade from daily closing prices, as of October 29, 2026. Technical data, not a recommendation.
Analyst ratings
Analyst consensus: Buy
Based on 3 analyst ratings
Third-party analyst opinion, not a recommendation from Gotrade.
Financials
Performance
Debt & Balance Sheet
Revenue to Profit
2025Earnings
The market is expecting earnings per share of $0.09 for this quarter. The company has not yet shared when it is announcing earnings.
Source: third-party data provider
Latest news
ERIC vs. NOK: Which 5G Infrastructure Stock is the Better Buy Now?
ERIC vs. NOK: Which 5G Infrastructure Stock is the Better Buy Now?
NOKNokia Climbs 3% on Five-Year India R&D Deal; Ericsson Edges Higher
Nokia Climbs 3% on Five-Year India R&D Deal; Ericsson Edges Higher
NOKSPCX, SMCI, NOK, TSLA, NFLX: Why Retail Traders Couldn’t Take Their Eyes Off These Stocks Last Week
SPCX, SMCI, NOK, TSLA, NFLX: Why Retail Traders Couldn’t Take Their Eyes Off These Stocks Last Week
NOKSpaceX’s 80,000 Cell Site Push A Win For AST SpaceMobile, Ericsson, Nokia, NextNav, Among Others, Says Roth Capital
SpaceX’s 80,000 Cell Site Push A Win For AST SpaceMobile, Ericsson, Nokia, NextNav, Among Others, Says Roth Capital
NOK
In hunt for Starlink alternative, Ukraine partners with Nokia and satellite maker ICEYE
In hunt for Starlink alternative, Ukraine partners with Nokia and satellite maker ICEYE
NOK
Nokia: 3 Key Takeaways for Long-Term Investors
Nokia: 3 Key Takeaways for Long-Term Investors
NOK
Nokia Q3 Earnings Call Highlights AI Growth and 2027 Outlook
Nokia Q3 Earnings Call Highlights AI Growth and 2027 Outlook
NOK
Ciena vs. Nokia: Which Optical Networking Stock is the Better Buy?
Ciena vs. Nokia: Which Optical Networking Stock is the Better Buy?
NOK
Nokia Q3 Earnings Call Highlights
Nokia Q3 Earnings Call Highlights
NOK
Why Nokia Sank today
Why Nokia Sank today
NOKNews tone: automated (AI) classification of the article's content, not a price prediction.
About Nokia
We create the critical networks and technologies to bring together the world’s intelligence, across businesses, cities, supply chains and societies. With our commitment to innovation and technology leadership, driven by the award-winning Nokia Bell Labs, we deliver networks at the limits of science across mobile, infrastructure, cloud, and enabling technologies. Adhering to the highest standards of integrity and security, we help build the capabilities we need for a more productive, sustainable and inclusive world.
Key Executives
| Name | Title | Year Born |
|---|---|---|
| Mr. Justin Hotard | President & CEO | 1974 |
| Mr. Marco Wiren M.Sc. (Econ.) | Chief Financial Officer | 1966 |
| Mr. Stephan Prosi | Vice President of Corporate Controlling & Accounting | — |
| Ms. Pallavi Mahajan | Chief Technology & AI Officer | 1977 |
| Mr. Esa Niinimaki | Chief Legal & Admin. Officer, Corporate and Secretary | 1976 |
| Mr. David Terence Mulholland C.F.A. | Head of Investor Relations | — |
| Ms. Louise Fisk | Chief Communications & Marketing Officer | 1976 |
| Mr. Konstanty Owczarek | Chief Corporate Development Officer | 1979 |
| Ms. Kristen Pressner | Chief People Officer | 1970 |
| Ms. Lise Karstensen | Head of Nordic&Baltic, Global Enterprise & Public Sector and Country Director of Denmark | — |
Fundamentals
Valuation
Profitability
Trading
Dividend
Source: third-party data provider, as of October 31, 2026
Technical indicators
- RSI 14
- 47.68
- MACD 12/26/9
- -0.38
- EMA 9 of MACD
- -0.38
- MACD histogram
- -0.00
- SMA 50
- $10.00
- Price below SMA 50
- EMA 50
- $9.89
- Price below EMA 50
- SMA 200
- $10.30
- Price below SMA 200
- EMA 200
- $9.61
- Price below EMA 200
Calculated by Gotrade from daily closing prices, as of October 29, 2026. Technical data, not a recommendation.
Analyst views
3 analyst ratings
Third-party analyst opinion, not a recommendation from Gotrade.
- Low
- $14.00
- Average
- $16.50
- High
- $20.50
Seasonality
Monthly price change (%)| Jan | Feb | Mar | Apr | May | Jun | Jul | Aug | Sep | Oct | Nov | Dec | |
|---|---|---|---|---|---|---|---|---|---|---|---|---|
| 2021 | -1.6 | +11.9 | ||||||||||
| 2022 | -6.2 | -9.9 | +5.4 | -9.2 | -2.3 | -7.2 | +11.2 | -3.4 | -14.3 | +0.2 | +11.5 | -7.2 |
| 2023 | +1.5 | -5.3 | +6.7 | -14.1 | -3.6 | +2.7 | -7.1 | +1.0 | -6.3 | -11.0 | +7.4 | -2.0 |
| 2024 | +5.6 | -1.7 | -0.6 | +4.3 | +6.8 | -4.3 | +0.8 | +12.9 | -0.2 | +8.3 | -11.2 | +5.5 |
| 2025 | +3.1 | +3.9 | +5.2 | -6.6 | +4.6 | -2.4 | -22.0 | +6.2 | +13.7 | +43.4 | -15.0 | +5.7 |
| 2026 | -1.2 | +15.9 | -2.7 | +56.1 | +11.6 | -18.3 | -29.2 | +8.3 | +2.1 | -10.2 |










