
Ovintiv (OVV) Stock
Key stats
- Market cap
- $17.05B
- Price / Earnings ratio
- 12.5x
- EPS (TTM)
- $4.98
- Volume
- Loading
- 52-week high
- $73.62
- 52-week low
- $36.81
- Dividend yield
- 1.89%
- Dividend amount (latest)
- $0.30
- EPS vs analyst estimate
- +7.3%Q3 FY25 · $1.03 vs $0.96
Source: third-party data provider, as of November 13, 2026
EPS estimate: analyst consensus
Compare with OVV
Recent news

Ovintiv (OVV) Q3 Earnings: Taking a Look at Key Metrics Versus Estimates
Ovintiv (OVV) Q3 Earnings: Taking a Look at Key Metrics Versus Estimates
OVV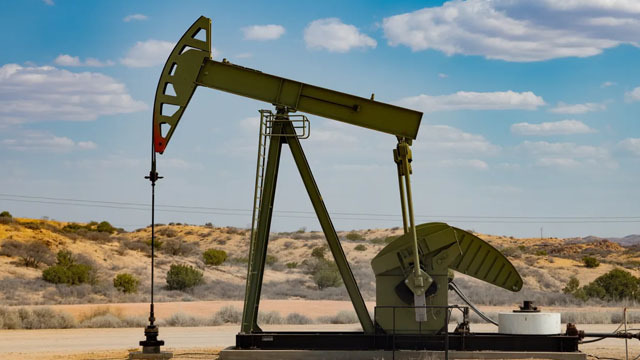
Ovintiv (OVV) Lags Q3 Earnings Estimates
Ovintiv (OVV) Lags Q3 Earnings Estimates
OVV
Ovintiv Is Quietly Building an AI Advantage That Wall Street May Be Missing
Ovintiv Is Quietly Building an AI Advantage That Wall Street May Be Missing
OVV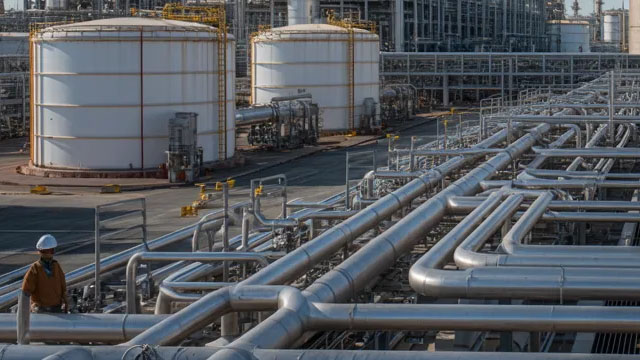
Ovintiv (OVV) Upgraded to Strong Buy: What Does It Mean for the Stock?
Ovintiv (OVV) Upgraded to Strong Buy: What Does It Mean for the Stock?
OVVNews tone: automated (AI) classification of the article's content, not a price prediction.
Technical indicators
- RSI 14
- 44.34
- MACD 12/26/9
- -0.88
- EMA 9 of MACD
- 0.25
- MACD histogram
- -1.12
- SMA 50
- $64.60
- Price below SMA 50
- EMA 50
- $64.73
- Price below EMA 50
- SMA 200
- $58.54
- Price above SMA 200
- EMA 200
- $57.21
- Price above EMA 200
Calculated by Gotrade from daily closing prices, as of November 11, 2026. Technical data, not a recommendation.
Analyst ratings
Analyst consensus: Buy
Based on 12 analyst ratings
Third-party analyst opinion, not a recommendation from Gotrade.
Financials
Performance
Debt & Balance Sheet
Revenue to Profit
2025Earnings
The market is expecting earnings per share of $1.08 for this quarter. The company has not yet shared when it is announcing earnings.
Source: third-party data provider
Latest news
Ovintiv (OVV) Q3 Earnings: Taking a Look at Key Metrics Versus Estimates
Ovintiv (OVV) Q3 Earnings: Taking a Look at Key Metrics Versus Estimates
OVVOvintiv (OVV) Lags Q3 Earnings Estimates
Ovintiv (OVV) Lags Q3 Earnings Estimates
OVVOvintiv Is Quietly Building an AI Advantage That Wall Street May Be Missing
Ovintiv Is Quietly Building an AI Advantage That Wall Street May Be Missing
OVVOvintiv (OVV) Upgraded to Strong Buy: What Does It Mean for the Stock?
Ovintiv (OVV) Upgraded to Strong Buy: What Does It Mean for the Stock?
OVV
Best Momentum Stocks to Buy for October 28th
Best Momentum Stocks to Buy for October 28th
OVV
New Strong Buy Stocks for October 28th
New Strong Buy Stocks for October 28th
OVV
Best Value Stocks to Buy for October 28th
Best Value Stocks to Buy for October 28th
OVV
Best Income Stocks to Buy for October 28th
Best Income Stocks to Buy for October 28th
OVV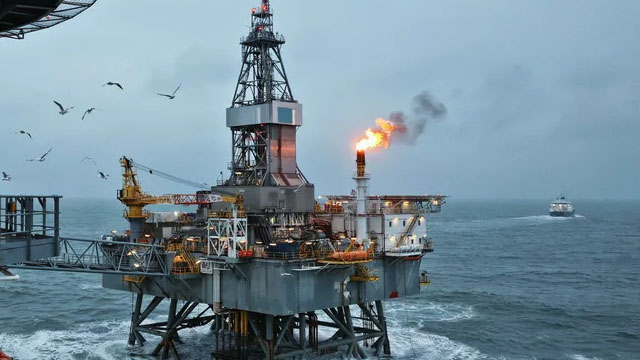
Ovintiv Expands Montney Operations Through Logan Acquisition
Ovintiv Expands Montney Operations Through Logan Acquisition
OVV
Ovintiv (OVV) Earnings Expected to Grow: Should You Buy?
Ovintiv (OVV) Earnings Expected to Grow: Should You Buy?
OVVNews tone: automated (AI) classification of the article's content, not a price prediction.
About Ovintiv
The independent oil firm Ovintiv Inc. is based in the United States. The corporation was established in 2020 as a result of Encana, its Canadian predecessor, being restructured. In the United States and Canada, Ovintiv Inc., along with its subsidiaries, explores, develops, produces, and distributes natural gas, oil, and natural gas liquids.
Key Executives
| Name | Title | Year Born |
|---|---|---|
| Mr. Brendan Michael McCracken | President, CEO & Director | 1976 |
| Mr. Corey Douglas Code CPA | Executive VP & CFO | 1974 |
| Mr. Gregory Dean Givens | Executive VP & COO | 1973 |
| Ms. Meghan Nicole Eilers | Executive Vice President of Commercial and Legal Affairs | 1982 |
| Ms. Rachel Maureen Moore CHRP | Executive Vice President of Corporate Services | 1972 |
Fundamentals
Valuation
Profitability
Trading
Dividend
Source: third-party data provider, as of November 13, 2026
Technical indicators
- RSI 14
- 44.34
- MACD 12/26/9
- -0.88
- EMA 9 of MACD
- 0.25
- MACD histogram
- -1.12
- SMA 50
- $64.60
- Price below SMA 50
- EMA 50
- $64.73
- Price below EMA 50
- SMA 200
- $58.54
- Price above SMA 200
- EMA 200
- $57.21
- Price above EMA 200
Calculated by Gotrade from daily closing prices, as of November 11, 2026. Technical data, not a recommendation.
Analyst views
12 analyst ratings
Third-party analyst opinion, not a recommendation from Gotrade.
- Low
- $71.00
- Average
- $79.27
- High
- $90.00
Seasonality
Monthly price change (%)| Jan | Feb | Mar | Apr | May | Jun | Jul | Aug | Sep | Oct | Nov | Dec | |
|---|---|---|---|---|---|---|---|---|---|---|---|---|
| 2021 | -3.2 | +3.0 | ||||||||||
| 2022 | +10.5 | +12.4 | +14.7 | -7.3 | +9.9 | -24.1 | +17.4 | +8.5 | -9.8 | +0.8 | +8.8 | -7.0 |
| 2023 | +4.7 | -10.0 | -20.2 | -10.6 | -8.0 | +11.7 | +22.7 | +0.2 | -1.5 | +4.8 | -6.9 | -0.6 |
| 2024 | -3.9 | +17.3 | +3.0 | -1.5 | +1.9 | -3.1 | -1.1 | -3.7 | -7.3 | -2.8 | +16.6 | -8.5 |
| 2025 | +1.5 | +3.6 | +7.9 | -23.5 | +4.2 | +4.0 | +4.8 | +6.8 | -5.5 | -7.5 | +9.1 | -5.7 |
| 2026 | +7.4 | +19.1 | +13.8 | +7.2 | -7.9 | -9.4 | +20.2 | +6.1 | -13.2 | +21.1 | -6.4 |













