Dave & Buster's Entertainment Inc (PLAY) Stock
Key stats
- Market cap
- $279.69M
- Price / Earnings ratio
- -3.2x
- EPS (TTM)
- -$2.56
- Volume
- Loading
- 52-week high
- $22.10
- 52-week low
- $6.26
Source: third-party data provider, as of November 13, 2026
Compare with PLAY
Recent news

Dave & Buster's (PLAY) Up 7.7% Since Last Earnings Report: Can It Continue?
Dave & Buster's (PLAY) Up 7.7% Since Last Earnings Report: Can It Continue?
PLAY
Bear of the Day: Dave & Buster's (PLAY)
Bear of the Day: Dave & Buster's (PLAY)
PLAY
Why Dave & Buster's Stock Tumbled Today
Why Dave & Buster's Stock Tumbled Today
PLAY
Could Dave & Buster's Capitulation Signal the Bottom Is Finally In?
Could Dave & Buster's Capitulation Signal the Bottom Is Finally In?
PLAYNews tone: automated (AI) classification of the article's content, not a price prediction.
Technical indicators
- RSI 14
- 52.77
- MACD 12/26/9
- 0.19
- EMA 9 of MACD
- 0.16
- MACD histogram
- 0.03
- SMA 50
- $7.49
- Price above SMA 50
- EMA 50
- $7.98
- Price above EMA 50
- SMA 200
- $11.11
- Price below SMA 200
- EMA 200
- $11.18
- Price below EMA 200
Calculated by Gotrade from daily closing prices, as of November 11, 2026. Technical data, not a recommendation.
Analyst ratings
Analyst consensus: Hold
Based on 3 analyst ratings
Third-party analyst opinion, not a recommendation from Gotrade.
Financials
Performance
Debt & Balance Sheet
Revenue to Profit
2026Earnings
The market is expecting earnings per share of $0.50 for this quarter. The company has not yet shared when it is announcing earnings.
Source: third-party data provider
Latest news
Dave & Buster's (PLAY) Up 7.7% Since Last Earnings Report: Can It Continue?
Dave & Buster's (PLAY) Up 7.7% Since Last Earnings Report: Can It Continue?
PLAYBear of the Day: Dave & Buster's (PLAY)
Bear of the Day: Dave & Buster's (PLAY)
PLAYWhy Dave & Buster's Stock Tumbled Today
Why Dave & Buster's Stock Tumbled Today
PLAYCould Dave & Buster's Capitulation Signal the Bottom Is Finally In?
Could Dave & Buster's Capitulation Signal the Bottom Is Finally In?
PLAY
Dave & Buster's Stock Plunges After a Surprise Loss
Dave & Buster's Stock Plunges After a Surprise Loss
PLAY
Tuesday's First Moves: LLY & ETSY Upgrades, PLAY Plunges After Earnings
Tuesday's First Moves: LLY & ETSY Upgrades, PLAY Plunges After Earnings
PLAY
Dave & Buster's Retreats 4% on Sales Miss; Six Flags Slips 2%, Lucky Strike Entertainment Falls 1%
Dave & Buster's Retreats 4% on Sales Miss; Six Flags Slips 2%, Lucky Strike Entertainment Falls 1%
PLAY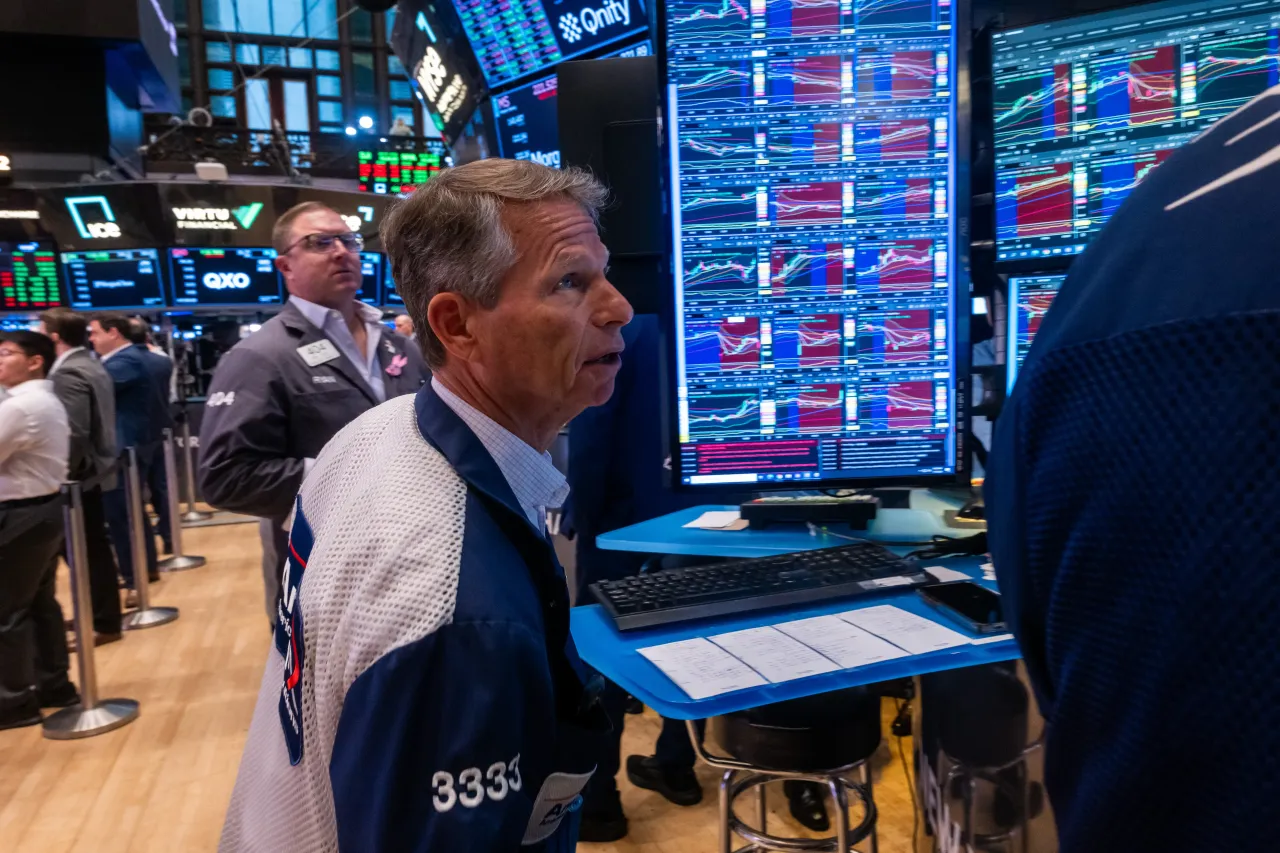
Dow, S&P 500, Nasdaq Futures Mixed Ahead Of Fed Rate Decision As AI Uncertainty Mounts: IOVA, PLAY, ELMT, RBLX Stocks In Focus
Dow, S&P 500, Nasdaq Futures Mixed Ahead Of Fed Rate Decision As AI Uncertainty Mounts: IOVA, PLAY, ELMT, RBLX Stocks In Focus
PLAY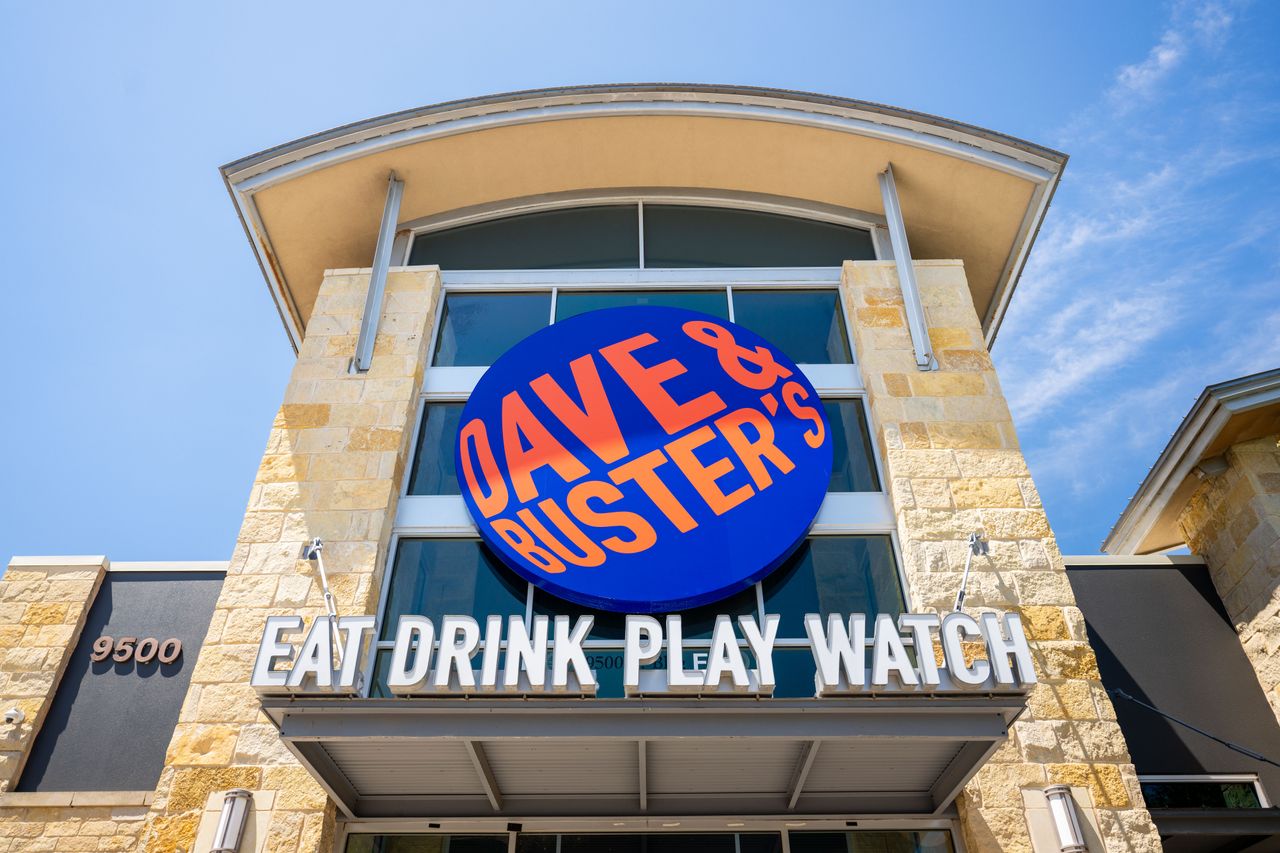
PLAY Stock Tanks Overnight After Surprise Loss, But Retail Stays Bullish As CEO Sees Turnaround Signs
PLAY Stock Tanks Overnight After Surprise Loss, But Retail Stays Bullish As CEO Sees Turnaround Signs
PLAY
Dave & Buster's Entertainment Q2 Earnings Call Highlights
Dave & Buster's Entertainment Q2 Earnings Call Highlights
PLAYNews tone: automated (AI) classification of the article's content, not a price prediction.
About Dave & Buster's Entertainment Inc
Dave & Buster's Entertainment Inc owns and operates nearly a hundred entertainment and dining establishments in the United States where customers can eat, drink, play games, and watch televised sports. Each store offers a full menu of entries and appetizers, a complete selection of alcoholic and non-alcoholic beverages, and an extensive assortment of entertainment attractions centered around playing games and watching live sports and other televised events. It derives maximum revenue from Entertainment.
Key Executives
| Name | Title | Year Born |
|---|---|---|
| Mr. Darin E. Harper | CEO & Director | 1975 |
| Mr. Cory Hatton | Interim CFO, Head of Entertainment Finance, Investor Relations & Treasurer | — |
| Mr. Antonio Bautista | President of International Development | 1965 |
| Mr. Tony Wehner | President of Main Event | 1969 |
| Mr. Tarun Lal | Advisor | 1969 |
| Ms. Amanda Busby | Chief Operations Officer | 1973 |
| Mr. Derek Sample | Chief Accounting Officer | 1987 |
| Mr. Kevin Fish | Chief Technology & Digital Officer | — |
| Ms. Rachel Morgan | Chief Legal & Administrative Officer and Corporate Secretary | 1972 |
| Mr. Jeremy Tucker | Chief Marketing Officer | — |
Fundamentals
Valuation
Profitability
Trading
Dividend
Source: third-party data provider, as of November 13, 2026
Technical indicators
- RSI 14
- 52.77
- MACD 12/26/9
- 0.19
- EMA 9 of MACD
- 0.16
- MACD histogram
- 0.03
- SMA 50
- $7.49
- Price above SMA 50
- EMA 50
- $7.98
- Price above EMA 50
- SMA 200
- $11.11
- Price below SMA 200
- EMA 200
- $11.18
- Price below EMA 200
Calculated by Gotrade from daily closing prices, as of November 11, 2026. Technical data, not a recommendation.
Analyst views
3 analyst ratings
Third-party analyst opinion, not a recommendation from Gotrade.
- Low
- $9.00
- Average
- $10.33
- High
- $13.00
Seasonality
Monthly price change (%)| Jan | Feb | Mar | Apr | May | Jun | Jul | Aug | Sep | Oct | Nov | Dec | |
|---|---|---|---|---|---|---|---|---|---|---|---|---|
| 2021 | -14.5 | +27.4 | ||||||||||
| 2022 | -8.7 | +18.8 | +11.3 | -5.7 | -18.2 | -13.6 | +10.8 | +9.0 | -25.6 | +27.2 | +4.2 | -9.6 |
| 2023 | +22.2 | -9.3 | -7.8 | -1.4 | -9.5 | +37.8 | +2.7 | -13.5 | -6.6 | -5.3 | +20.1 | +24.8 |
| 2024 | -1.3 | +13.7 | +0.2 | -17.1 | -2.3 | -24.0 | -2.9 | -12.4 | +11.8 | +10.6 | +2.0 | -25.2 |
| 2025 | -12.3 | -24.5 | -8.2 | +6.0 | +17.3 | +38.7 | -6.1 | -8.6 | -27.7 | -18.6 | +20.8 | -7.5 |
| 2026 | +10.2 | -26.7 | -23.9 | -10.3 | +15.0 | -10.8 | -5.9 | -22.5 | -24.5 | +21.8 | -5.6 |