
POET Technologies Inc. Common Shares (POET) Stock
NASDAQ · POET
Key stats
- Market cap
- $967.39M
- Price / Earnings ratio
- -10.2x
- EPS (TTM)
- -$0.69
- Volume
- Loading
- 52-week high
- $20.81
- 52-week low
- $3.87
Source: third-party data provider, as of November 13, 2026
Compare with POET
Recent news
24/7 Wall Street
POET Is Targeting the Problem Standing Between AI and More Speed
NeutralPOETOctober 30, 2026
24/7 Wall StreetNeutral
POET Is Targeting the Problem Standing Between AI and More Speed
POET
24/7 Wall Street
POET Technologies Could Be Sitting on a Much Bigger Opportunity Than Investors Realize
NeutralPOETOctober 15, 2026
24/7 Wall StreetNeutral
POET Technologies Could Be Sitting on a Much Bigger Opportunity Than Investors Realize
POET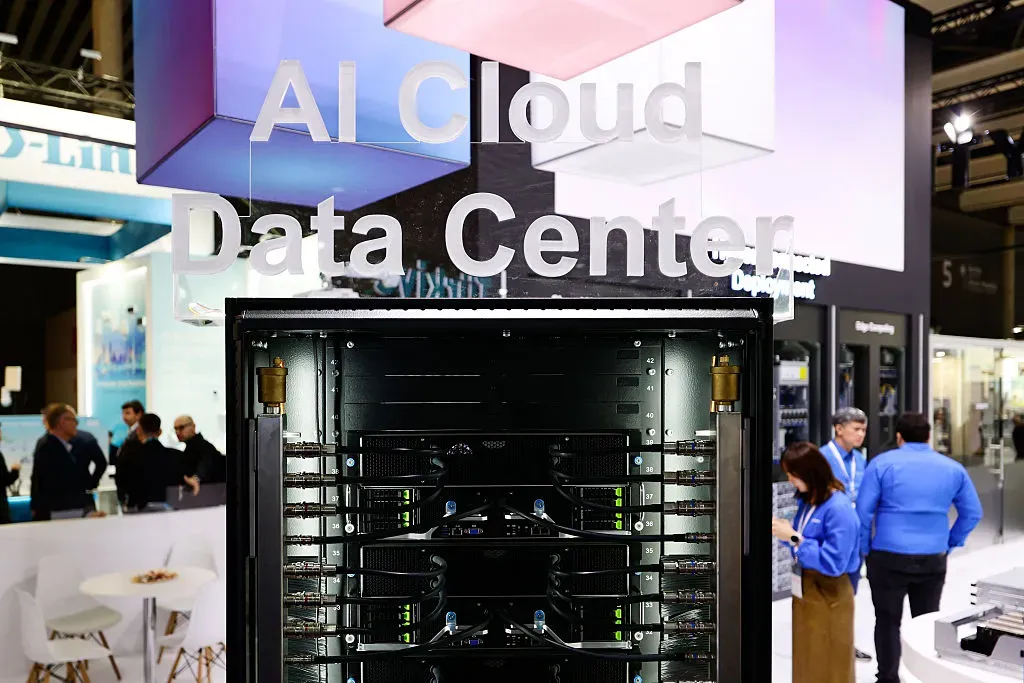
Stocktwits
LITE, COHR, AAOI, POET Rise Overnight After Lumentum CEO Says Optical Parts Are ‘Completely Sold Out’ Through Early 2029
POETOctober 9, 2026
Stocktwits
LITE, COHR, AAOI, POET Rise Overnight After Lumentum CEO Says Optical Parts Are ‘Completely Sold Out’ Through Early 2029
POET
24/7 Wall Street
One Under-the-Radar Stock With 100% Upside Potential
PositivePOETSeptember 22, 2026
24/7 Wall StreetPositive
One Under-the-Radar Stock With 100% Upside Potential
POETNews tone: automated (AI) classification of the article's content, not a price prediction.
Technical indicators
- RSI 14
- 48.26
- MACD 12/26/9
- -0.45
- EMA 9 of MACD
- -0.54
- MACD histogram
- 0.09
- SMA 50
- $6.64
- Price below SMA 50
- EMA 50
- $6.40
- Price below EMA 50
- SMA 200
- $8.16
- Price below SMA 200
- EMA 200
- $7.44
- Price below EMA 200
Calculated by Gotrade from daily closing prices, as of November 11, 2026. Technical data, not a recommendation.
Analyst ratings
No analyst data available
Financials
Performance
Revenue
Net income
Net margin %
2021
2022
2023
2024
2025
1M8512934256470
Debt & Balance Sheet
Total assets
Total liabilities
2021
2022
2023
2024
2025
394M260M130M0
Revenue to Profit
2025$1.1M
Revenue$0.0
Cost of revenue$1.1M
Gross profit$0.0
Operating expenses$-63.0M
Net incomeEarnings
No data available
Source: third-party data provider
Latest news
24/7 Wall Street
POET Is Targeting the Problem Standing Between AI and More Speed
NeutralPOETOctober 30, 2026
24/7 Wall StreetNeutral
POET Is Targeting the Problem Standing Between AI and More Speed
POET24/7 Wall Street
POET Technologies Could Be Sitting on a Much Bigger Opportunity Than Investors Realize
NeutralPOETOctober 15, 2026
24/7 Wall StreetNeutral
POET Technologies Could Be Sitting on a Much Bigger Opportunity Than Investors Realize
POETStocktwits
LITE, COHR, AAOI, POET Rise Overnight After Lumentum CEO Says Optical Parts Are ‘Completely Sold Out’ Through Early 2029
POETOctober 9, 2026
Stocktwits
LITE, COHR, AAOI, POET Rise Overnight After Lumentum CEO Says Optical Parts Are ‘Completely Sold Out’ Through Early 2029
POET24/7 Wall Street
One Under-the-Radar Stock With 100% Upside Potential
PositivePOETSeptember 22, 2026
24/7 Wall StreetPositive
One Under-the-Radar Stock With 100% Upside Potential
POET
24/7 Wall Street
This Little-Known AI Company Is Quietly Building for the Data Center Boom
POETAugust 31, 2026
24/7 Wall Street
This Little-Known AI Company Is Quietly Building for the Data Center Boom
POET
24/7 Wall Street
Prediction: The Tiny AI Stock Has a Massive Opportunity in Optical Computing
POETAugust 19, 2026
24/7 Wall Street
Prediction: The Tiny AI Stock Has a Massive Opportunity in Optical Computing
POET
Stocktwits
POET Stock Gains After Sixth Straight Quarter Of Revenue Growth – CEO Says 2026 Production Ramp ‘On Schedule’
POETAugust 13, 2026
Stocktwits
POET Stock Gains After Sixth Straight Quarter Of Revenue Growth – CEO Says 2026 Production Ramp ‘On Schedule’
POET
24/7 Wall Street
Big Cash, Bigger Ambitions: POET Technologies Eyes 147% Upside
POETAugust 12, 2026
24/7 Wall Street
Big Cash, Bigger Ambitions: POET Technologies Eyes 147% Upside
POET
Stocktwits
Why Is AAOI Stock Surging 10% Premarket?
POETAugust 7, 2026
Stocktwits
Why Is AAOI Stock Surging 10% Premarket?
POET
Stocktwits
COHR, AAOI, LITE, POET: Photonic Stocks Join Google Capex-Fueled AI Rally
POETJuly 23, 2026
Stocktwits
COHR, AAOI, LITE, POET: Photonic Stocks Join Google Capex-Fueled AI Rally
POETNews tone: automated (AI) classification of the article's content, not a price prediction.
About POET Technologies Inc. Common Shares
No description available.
SectorTechnology
IndustrySemiconductors
Employees80
CEODr. Suresh V. Venkatesan Ph.D.
IPO DateJan 4, 2016
HeadquartersToronto, ON
Key Executives
| Name | Title | Year Born |
|---|---|---|
| Dr. Suresh V. Venkatesan Ph.D. | Executive Chairman & CEO | 1967 |
| Mr. Thomas R. Mika MBA | Executive VP, CFO & Corporate Secretary | 1953 |
| Dr. Sandeep P. Kumar Ph.D. | Chief Operating Officer | 1965 |
| Mr. Kevin Barnes CMA, PFP | Senior Vice President of Finance & Administration and Treasurer | 1972 |
| Mr. Yong Meng Lee | Senior Vice President of Interposer Development & Engineering | 1972 |
| Dr. Jinyu Mo | Senior Vice President of Global Product Development | 1975 |
| Mr. Raju Kankipati | Chief Revenue Officer | 1978 |
| Dr. Ghazi Chaoui | Senior Vice President of Strategic Partnerships | — |
| Dr. Robert Ditizio | Vice President of Intellectual Property | 1963 |
Fundamentals
Valuation
Price-to-sales ratio721.21
Price-to-book value0.91
Profitability
Return on Equity-20.00%
Return on Assets-17.00%
Return on Sales-4409.00%
Gross margin (latest quarter)100.00%
EBITDA$-71.75M
Trading
Average volume8,414,961
Source: third-party data provider, as of November 13, 2026
Technical indicators
- RSI 14
- 48.26
- MACD 12/26/9
- -0.45
- EMA 9 of MACD
- -0.54
- MACD histogram
- 0.09
- SMA 50
- $6.64
- Price below SMA 50
- EMA 50
- $6.40
- Price below EMA 50
- SMA 200
- $8.16
- Price below SMA 200
- EMA 200
- $7.44
- Price below EMA 200
Calculated by Gotrade from daily closing prices, as of November 11, 2026. Technical data, not a recommendation.
Analyst views
No analyst data available
Seasonality
Monthly price change (%)| Jan | Feb | Mar | Apr | May | Jun | Jul | Aug | Sep | Oct | Nov | Dec | |
|---|---|---|---|---|---|---|---|---|---|---|---|---|
| 2022 | -18.0 | -4.9 | -10.1 | -3.7 | -14.8 | -16.1 | -34.4 | -10.2 | +22.0 | +0.7 | ||
| 2023 | +50.6 | -7.7 | -6.1 | +3.3 | -1.6 | +1.4 | -4.5 | -7.4 | -19.7 | -9.4 | -67.6 | -17.5 |
| 2024 | +44.1 | -1.4 | +3.0 | +107.6 | -33.8 | +19.7 | +3.6 | +7.5 | +49.5 | -17.9 | +47.0 | +20.2 |
| 2025 | -22.7 | -14.0 | +9.6 | +11.2 | +4.6 | +24.6 | +5.2 | -0.7 | +4.5 | +8.4 | -25.0 | +37.3 |
| 2026 | -19.0 | +2.7 | -14.0 | +27.1 | +68.1 | -26.0 | -27.9 | +1.4 | +5.4 | -31.9 | +16.5 |
Compare stocks
Market cap
$967.39M
-
-
-
Price / Earnings ratio
-10.20
-
-
-
Price / Sales ratio
721.21
-
-
-
Dividend yield
0.00%
-
-
-
Average volume
8,414,961
-
-
-
Earnings per share
$-0.69
-
-
-










