
NASDAQ 100 ETF (QQQ) Stock
Key stats
- Market cap
- $178.46B
- Price / Earnings ratio
- 0.0x
- Volume
- Loading
- 52-week high
- $762.86
- 52-week low
- $555.60
Source: third-party data provider, as of October 24, 2026
Recent news

'Big Short' Investor Michael Burry Bumps Up Substack Subscription Price, Flags 4 'Busted' Bear-Market Havens
'Big Short' Investor Michael Burry Bumps Up Substack Subscription Price, Flags 4 'Busted' Bear-Market Havens
QQQ
Stocktwits AI Roundup: Meta’s Capex, Lam’s Supply Warning Hit Tech Stocks As Netflix Disappoints
Stocktwits AI Roundup: Meta’s Capex, Lam’s Supply Warning Hit Tech Stocks As Netflix Disappoints
QQQ
Nasdaq Futures Rise After Chip Selloff While S&P 500, Dow Track Mixed Open: SLV, GLD, SOXL, BE In Focus
Nasdaq Futures Rise After Chip Selloff While S&P 500, Dow Track Mixed Open: SLV, GLD, SOXL, BE In Focus
QQQ
Nasdaq 100 Clocks Worst Day In Four Months As Investors Grow Weary Of Capex, Elevated Debt — META, SPCX, BE, MRNA In Focus
Nasdaq 100 Clocks Worst Day In Four Months As Investors Grow Weary Of Capex, Elevated Debt — META, SPCX, BE, MRNA In Focus
QQQTechnical indicators
- RSI 14
- 36.54
- MACD 12/26/9
- -3.57
- EMA 9 of MACD
- 1.39
- MACD histogram
- -4.95
- SMA 50
- $726.37
- Price below SMA 50
- EMA 50
- $726.21
- Price below EMA 50
- SMA 200
- $676.89
- Price above SMA 200
- EMA 200
- $680.25
- Price above EMA 200
Calculated by Gotrade from daily closing prices, as of October 22, 2026. Technical data, not a recommendation.
Analyst ratings
No analyst data available
Financials
Performance
No data available
Debt & Balance Sheet
No data available
Revenue to Profit
No data available
Earnings
No data available
Source: third-party data provider
Latest news
'Big Short' Investor Michael Burry Bumps Up Substack Subscription Price, Flags 4 'Busted' Bear-Market Havens
'Big Short' Investor Michael Burry Bumps Up Substack Subscription Price, Flags 4 'Busted' Bear-Market Havens
QQQStocktwits AI Roundup: Meta’s Capex, Lam’s Supply Warning Hit Tech Stocks As Netflix Disappoints
Stocktwits AI Roundup: Meta’s Capex, Lam’s Supply Warning Hit Tech Stocks As Netflix Disappoints
QQQNasdaq Futures Rise After Chip Selloff While S&P 500, Dow Track Mixed Open: SLV, GLD, SOXL, BE In Focus
Nasdaq Futures Rise After Chip Selloff While S&P 500, Dow Track Mixed Open: SLV, GLD, SOXL, BE In Focus
QQQNasdaq 100 Clocks Worst Day In Four Months As Investors Grow Weary Of Capex, Elevated Debt — META, SPCX, BE, MRNA In Focus
Nasdaq 100 Clocks Worst Day In Four Months As Investors Grow Weary Of Capex, Elevated Debt — META, SPCX, BE, MRNA In Focus
QQQ
SOXL Sinks To 6-Month Low As Nasdaq Slides Amid Oil Surge: Trump Blames Iran, But Wells Fargo Says Huang’s Comments Spooked Markets
SOXL Sinks To 6-Month Low As Nasdaq Slides Amid Oil Surge: Trump Blames Iran, But Wells Fargo Says Huang’s Comments Spooked Markets
QQQ
How Are Dow, S&P 500, Nasdaq Futures Trading After META, TSLA Earnings?
How Are Dow, S&P 500, Nasdaq Futures Trading After META, TSLA Earnings?
QQQ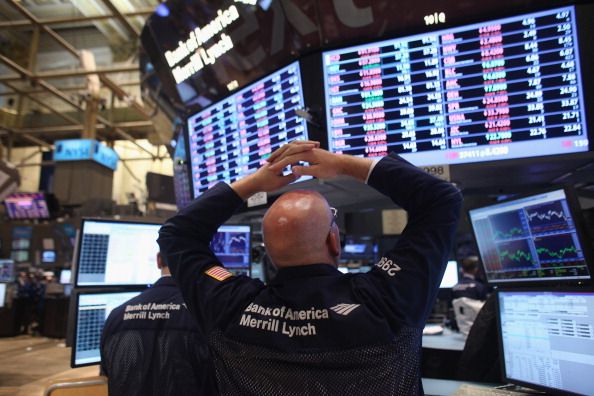
S&P 500, Nasdaq Gain, Powered By Meta, Tesla Stock — SPCX, META, TSLA, SKYD, IBM In Focus
S&P 500, Nasdaq Gain, Powered By Meta, Tesla Stock — SPCX, META, TSLA, SKYD, IBM In Focus
QQQ
META Stock Jumps 3% After-Hours After Q3 Revenue Beats Expectations, With A Narrowed AI Capex Outlook And New Non-Voting Class C Stock
META Stock Jumps 3% After-Hours After Q3 Revenue Beats Expectations, With A Narrowed AI Capex Outlook And New Non-Voting Class C Stock
QQQ
Chinese Stocks BABA, JD, PDD Slide After Hong Kong Tech Index Falls Below 4,000, Even As US Market Edges Higher
Chinese Stocks BABA, JD, PDD Slide After Hong Kong Tech Index Falls Below 4,000, Even As US Market Edges Higher
QQQ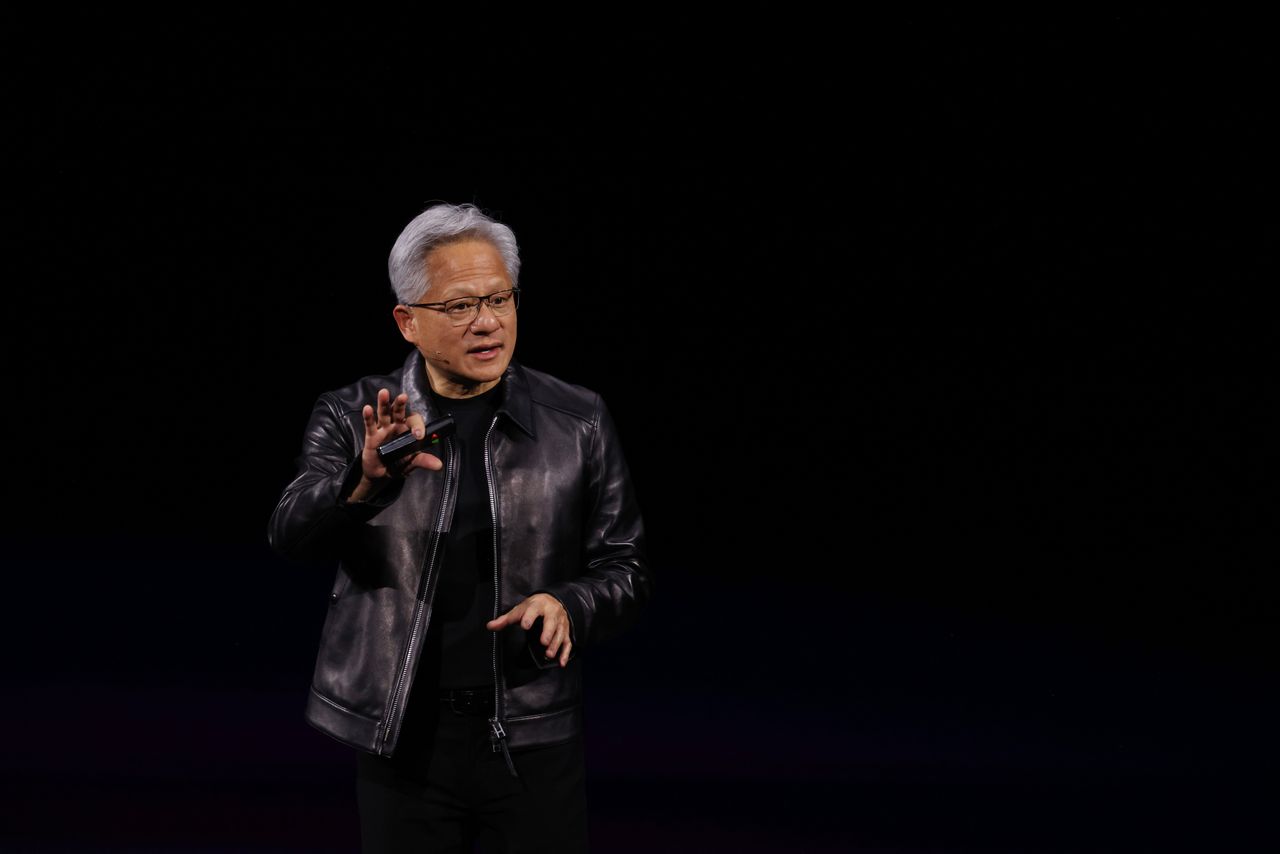
Nvidia’s Jensen Huang Sees 100GW AI Opportunity In Telecom Networks, With TMUS, NOK Already Making Moves
Nvidia’s Jensen Huang Sees 100GW AI Opportunity In Telecom Networks, With TMUS, NOK Already Making Moves
QQQAbout NASDAQ 100 ETF
The Nasdaq100 ETF tracks the Nasdaq100 index - typically known as the technology index. It measures the stock performance of 100 largest non-financial companies listed on Nasdaq stock exchange in the United States. It is dominated by big companies in the technology sector such as Apple, Amazon, Google, and Facebook. The average annual total return and compound annual growth rate of the index since 2001, has been approximately 9.3%.
Fundamentals
Trading
Dividend
Source: third-party data provider, as of October 24, 2026
Technical indicators
- RSI 14
- 36.54
- MACD 12/26/9
- -3.57
- EMA 9 of MACD
- 1.39
- MACD histogram
- -4.95
- SMA 50
- $726.37
- Price below SMA 50
- EMA 50
- $726.21
- Price below EMA 50
- SMA 200
- $676.89
- Price above SMA 200
- EMA 200
- $680.25
- Price above EMA 200
Calculated by Gotrade from daily closing prices, as of October 22, 2026. Technical data, not a recommendation.
Analyst views
No analyst data available
Seasonality
Monthly price change (%)| Jan | Feb | Mar | Apr | May | Jun | Jul | Aug | Sep | Oct | Nov | Dec | |
|---|---|---|---|---|---|---|---|---|---|---|---|---|
| 2021 | +2.2 | +1.6 | +2.8 | |||||||||
| 2022 | -9.6 | -5.1 | +6.2 | -13.4 | -3.2 | -8.4 | +11.8 | -5.1 | -10.7 | +1.6 | +6.6 | -9.3 |
| 2023 | +11.4 | -2.4 | +10.2 | +0.8 | +8.0 | +4.9 | +3.6 | -1.3 | -5.1 | -2.9 | +8.9 | +5.0 |
| 2024 | +3.6 | +4.1 | -0.4 | -4.6 | +6.9 | +5.7 | -2.3 | +3.6 | +5.7 | +0.5 | +4.6 | -0.8 |
| 2025 | +2.4 | -1.9 | -5.7 | +0.6 | +7.8 | +5.4 | +3.3 | +3.0 | +6.1 | +4.3 | -2.0 | -0.5 |
| 2026 | +1.4 | -3.0 | -5.1 | +14.3 | +9.5 | -0.9 | -5.1 | +2.4 | +4.5 | -5.1 |
Corporate actions
Upcoming
No upcoming corporate actions for QQQ










