
Red Cat Holdings, Inc. Common Stock (RCAT) Stock
Key stats
- Market cap
- $655.14M
- Price / Earnings ratio
- -6.6x
- EPS (TTM)
- -$0.80
- Volume
- Loading
- 52-week high
- $18.78
- 52-week low
- $3.25
Source: third-party data provider, as of November 13, 2026
Compare with RCAT
Recent news

5 Beaten-Down Growth Stocks Trading Like Value Plays as Cash Chases Mega-Caps
5 Beaten-Down Growth Stocks Trading Like Value Plays as Cash Chases Mega-Caps
RCAT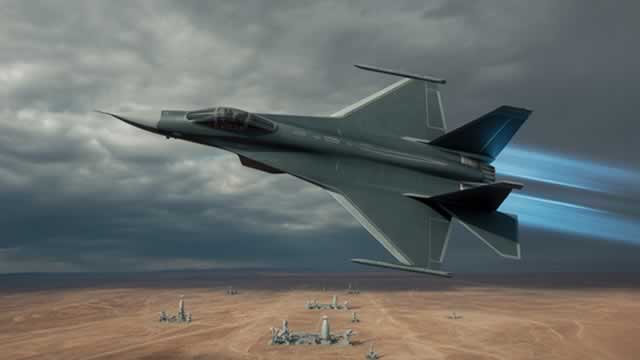
Drone Stocks Have Burned Investors—Are These 4 Different?
Drone Stocks Have Burned Investors—Are These 4 Different?
RCAT
INTC, EVAX, RCAT Stocks Move Higher Premarket — What’s Driving The Rally?
INTC, EVAX, RCAT Stocks Move Higher Premarket — What’s Driving The Rally?
RCAT
Red Cat Unveils New Long-Endurance Military Drone, Forms New Division – Retail Believes RCAT Stock Is A Long-Term Play
Red Cat Unveils New Long-Endurance Military Drone, Forms New Division – Retail Believes RCAT Stock Is A Long-Term Play
RCATNews tone: automated (AI) classification of the article's content, not a price prediction.
Technical indicators
- RSI 14
- 41.09
- MACD 12/26/9
- -0.50
- EMA 9 of MACD
- -0.57
- MACD histogram
- 0.08
- SMA 50
- $5.92
- Price below SMA 50
- EMA 50
- $5.77
- Price below EMA 50
- SMA 200
- $10.06
- Price below SMA 200
- EMA 200
- $8.89
- Price below EMA 200
Calculated by Gotrade from daily closing prices, as of November 11, 2026. Technical data, not a recommendation.
Analyst ratings
Analyst consensus: Buy
Based on 3 analyst ratings
Third-party analyst opinion, not a recommendation from Gotrade.
Financials
Performance
Debt & Balance Sheet
Revenue to Profit
2025Earnings
No data available
Source: third-party data provider
Latest news
5 Beaten-Down Growth Stocks Trading Like Value Plays as Cash Chases Mega-Caps
5 Beaten-Down Growth Stocks Trading Like Value Plays as Cash Chases Mega-Caps
RCATDrone Stocks Have Burned Investors—Are These 4 Different?
Drone Stocks Have Burned Investors—Are These 4 Different?
RCATINTC, EVAX, RCAT Stocks Move Higher Premarket — What’s Driving The Rally?
INTC, EVAX, RCAT Stocks Move Higher Premarket — What’s Driving The Rally?
RCATRed Cat Unveils New Long-Endurance Military Drone, Forms New Division – Retail Believes RCAT Stock Is A Long-Term Play
Red Cat Unveils New Long-Endurance Military Drone, Forms New Division – Retail Believes RCAT Stock Is A Long-Term Play
RCAT
Ondas Climbs 4% on Palantir-Powered Regna AI Venture, Red Cat Barely Budges After TRICHON Drone Debut
Ondas Climbs 4% on Palantir-Powered Regna AI Venture, Red Cat Barely Budges After TRICHON Drone Debut
RCAT
Ondas Adds $165M in New Orders, Boosts 2027 Revenue Visibility
Ondas Adds $165M in New Orders, Boosts 2027 Revenue Visibility
RCAT
AeroVironment Is Now Down 43% This Year. Is It Time to Sell This Dropping Drone Stock?
AeroVironment Is Now Down 43% This Year. Is It Time to Sell This Dropping Drone Stock?
RCAT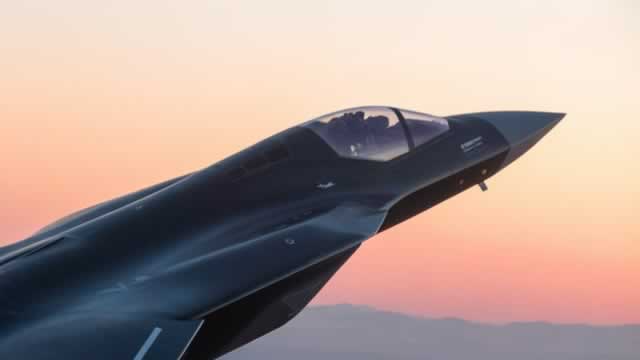
Which Drone Stock Is Dominating in 2026: Red Cat, Ondas, or AeroVironment?
Which Drone Stock Is Dominating in 2026: Red Cat, Ondas, or AeroVironment?
RCAT
ONDS, AVAV, KTOS, RCAT, UMAC Stocks Rise Overnight: Pentagon Maps Out AI-Driven Defense Shift With Autonomous Warfare Command
ONDS, AVAV, KTOS, RCAT, UMAC Stocks Rise Overnight: Pentagon Maps Out AI-Driven Defense Shift With Autonomous Warfare Command
RCAT
Red Cat's USV Mix: Could Blue Ops Accelerate Margin Gains in H2?
Red Cat's USV Mix: Could Blue Ops Accelerate Margin Gains in H2?
RCATNews tone: automated (AI) classification of the article's content, not a price prediction.
About Red Cat Holdings, Inc. Common Stock
No description available.
Key Executives
| Name | Title | Year Born |
|---|---|---|
| Mr. Jeffrey M. Thompson | Founder, President, CEO & Chairman | 1964 |
| Mr. Christian Koji Ericson | Chief Operating Officer | 1977 |
| Mr. Christian Morrison | CFO, Treasurer & Secretary | 1983 |
| Mr. Sam Pelletier | Vice President of Finance & Accounting | — |
Fundamentals
Valuation
Profitability
Trading
Source: third-party data provider, as of November 13, 2026
Technical indicators
- RSI 14
- 41.09
- MACD 12/26/9
- -0.50
- EMA 9 of MACD
- -0.57
- MACD histogram
- 0.08
- SMA 50
- $5.92
- Price below SMA 50
- EMA 50
- $5.77
- Price below EMA 50
- SMA 200
- $10.06
- Price below SMA 200
- EMA 200
- $8.89
- Price below EMA 200
Calculated by Gotrade from daily closing prices, as of November 11, 2026. Technical data, not a recommendation.
Analyst views
3 analyst ratings
Third-party analyst opinion, not a recommendation from Gotrade.
- Low
- $6.00
- Average
- $12.00
- High
- $15.00
Seasonality
Monthly price change (%)| Jan | Feb | Mar | Apr | May | Jun | Jul | Aug | Sep | Oct | Nov | Dec | |
|---|---|---|---|---|---|---|---|---|---|---|---|---|
| 2021 | -15.6 | +5.1 | ||||||||||
| 2022 | -22.4 | -3.3 | +17.4 | +4.1 | +0.5 | +5.7 | +6.9 | +12.2 | -28.6 | -19.6 | -7.1 | -18.3 |
| 2023 | +31.5 | +8.3 | -26.2 | -12.7 | +8.2 | +25.3 | -19.7 | -5.9 | +1.0 | -9.4 | +1.1 | -1.1 |
| 2024 | -21.2 | +5.8 | +2.7 | +96.2 | -33.8 | +17.3 | +67.5 | +47.4 | -13.9 | +4.1 | +284.6 | +21.6 |
| 2025 | -26.3 | -29.7 | +5.6 | -21.4 | +17.4 | +12.7 | +19.7 | +9.0 | +16.6 | +7.4 | -27.7 | +13.8 |
| 2026 | +47.4 | -14.5 | -4.2 | -3.5 | +29.1 | -28.2 | -28.6 | +4.0 | -21.7 | -26.9 | -3.6 |










