
Richtech Robotics Inc. Class B Common Stock (RR) Stock
Key stats
- Market cap
- $263.37M
- Price / Earnings ratio
- -4.9x
- EPS (TTM)
- -$0.05
- Volume
- Loading
- 52-week high
- $6.42
- 52-week low
- $1.20
- EPS vs analyst estimate
- 0.0%Q3 FY25 · -$0.04 vs -$0.04
Source: third-party data provider, as of October 24, 2026
EPS estimate: analyst consensus
Compare with RR
Recent news

Why Richtech Robotics Zoomed Nearly 32% Higher in August
Why Richtech Robotics Zoomed Nearly 32% Higher in August
RR
Why Richtech Robotics Stock Popped Today
Why Richtech Robotics Stock Popped Today
RR
Why Richtech Robotics Stock Dived by Nearly 35% in the First Half of 2026
Why Richtech Robotics Stock Dived by Nearly 35% in the First Half of 2026
RR
Why Did SMR, RR, FAC Stocks Plummet To 52-Week Lows?
Why Did SMR, RR, FAC Stocks Plummet To 52-Week Lows?
RRTechnical indicators
- RSI 14
- 27.27
- MACD 12/26/9
- -0.12
- EMA 9 of MACD
- -0.08
- MACD histogram
- -0.04
- SMA 50
- $1.64
- Price below SMA 50
- EMA 50
- $1.60
- Price below EMA 50
- SMA 200
- $2.29
- Price below SMA 200
- EMA 200
- $2.37
- Price below EMA 200
Calculated by Gotrade from daily closing prices, as of October 22, 2026. Technical data, not a recommendation.
Analyst ratings
No analyst data available
Financials
Performance
Debt & Balance Sheet
Revenue to Profit
2025Earnings
The market is expecting earnings per share of -$0.02 for this quarter. The company has not yet shared when it is announcing earnings.
Source: third-party data provider
Latest news
Why Richtech Robotics Zoomed Nearly 32% Higher in August
Why Richtech Robotics Zoomed Nearly 32% Higher in August
RRWhy Richtech Robotics Stock Popped Today
Why Richtech Robotics Stock Popped Today
RRWhy Richtech Robotics Stock Dived by Nearly 35% in the First Half of 2026
Why Richtech Robotics Stock Dived by Nearly 35% in the First Half of 2026
RRWhy Did SMR, RR, FAC Stocks Plummet To 52-Week Lows?
Why Did SMR, RR, FAC Stocks Plummet To 52-Week Lows?
RR
Why Richtech Robotics Stock Fell off a Cliff in June
Why Richtech Robotics Stock Fell off a Cliff in June
RR
Why Is RR Stock Falling Today?
Why Is RR Stock Falling Today?
RR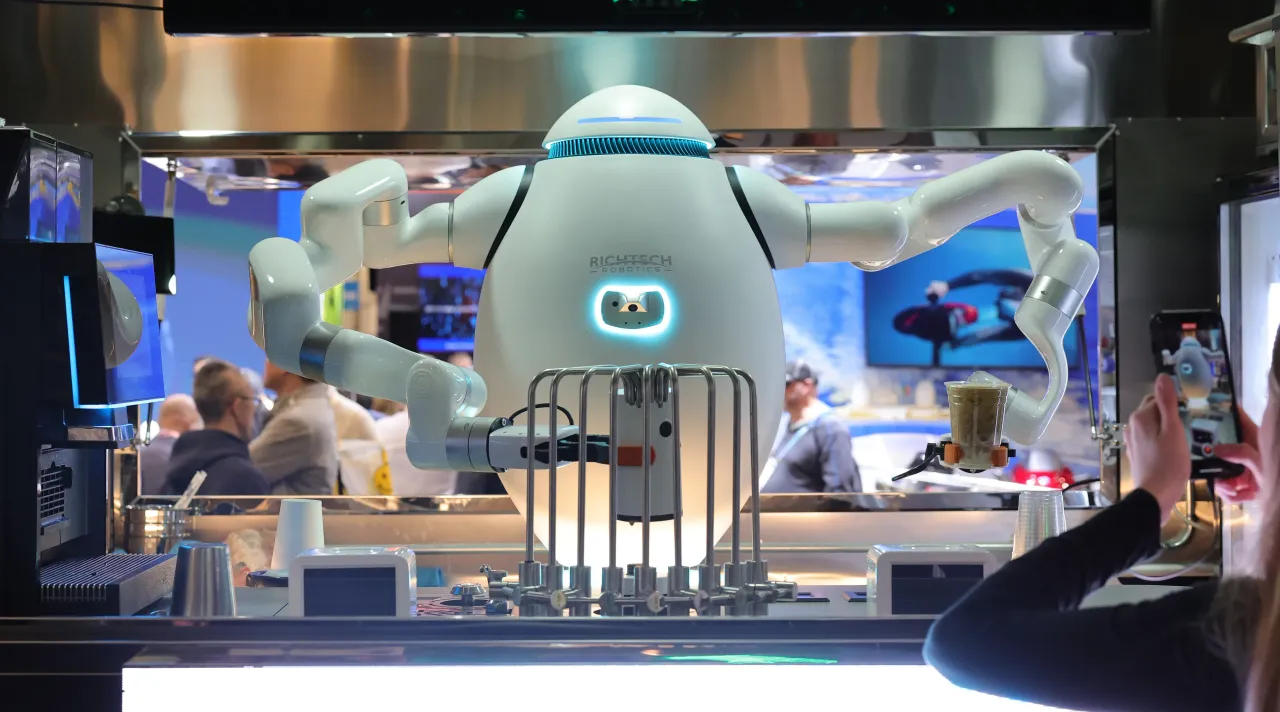
Richtech Robotics Stock Rallies 8% As European Distribution Deal Boosts Growth Strategy And Market Reach
Richtech Robotics Stock Rallies 8% As European Distribution Deal Boosts Growth Strategy And Market Reach
RR
RR CLASS ACTION DEADLINE TONIGHT: Faruqi & Faruqi, LLP Reminds Richtech Robotics Investors of the Securities Class Action Lawsuit Deadline on April 3, 2026
RR CLASS ACTION DEADLINE TONIGHT: Faruqi & Faruqi, LLP Reminds Richtech Robotics Investors of the Securities Class Action Lawsuit Deadline on April 3, 2026
RR
RR Investor Alert: Richtech Robotics Inc. Stockholders with Large Losses Should Contact Robbins LLP for Information About the Securities Fraud Class Action Lawsuit
RR Investor Alert: Richtech Robotics Inc. Stockholders with Large Losses Should Contact Robbins LLP for Information About the Securities Fraud Class Action Lawsuit
RR
APRIL 3RD LAWSUIT DEADLINE: Investors who lost over $100,000 with Richtech Robotics Inc. (NASDAQ: RR) with purchases between January 27 and 29, 2026 should contact the Shareholders Foundation
APRIL 3RD LAWSUIT DEADLINE: Investors who lost over $100,000 with Richtech Robotics Inc. (NASDAQ: RR) with purchases between January 27 and 29, 2026 should contact the Shareholders Foundation
RRAbout Richtech Robotics Inc. Class B Common Stock
htech Robotics Inc. (NASDAQ: RR) is a technology company specializing in the design, manufacture, and deployment of advanced service robots for hospitality, healthcare, retail, and other commercial sectors. Headquartered in Reno, Nevada, the company focuses on creating intelligent robotic solutions that automate repetitive and labor-intensive tasks, enhancing efficiency and customer experience. Its product lineup includes robots for food delivery, cleaning, and customer service, often integrated with AI-driven navigation and interaction systems. By combining robotics, artificial intelligence, and automation, Richtech Robotics aims to address global labor shortages and drive innovation in human-robot collaboration across industries.
Key Executives
| Name | Title | Year Born |
|---|---|---|
| Mr. Zhenwu Huang | Co-Founder, CEO & Director | 1976 |
| Mr. Phil Zheng | Chief Operating Officer | 1993 |
| Mr. Zhenqiang Huang | Co-Founder, CFO & Director | 1978 |
Fundamentals
Valuation
Profitability
Trading
Source: third-party data provider, as of October 24, 2026
Technical indicators
- RSI 14
- 27.27
- MACD 12/26/9
- -0.12
- EMA 9 of MACD
- -0.08
- MACD histogram
- -0.04
- SMA 50
- $1.64
- Price below SMA 50
- EMA 50
- $1.60
- Price below EMA 50
- SMA 200
- $2.29
- Price below SMA 200
- EMA 200
- $2.37
- Price below EMA 200
Calculated by Gotrade from daily closing prices, as of October 22, 2026. Technical data, not a recommendation.
Analyst views
No analyst data available
Seasonality
Monthly price change (%)| Jan | Feb | Mar | Apr | May | Jun | Jul | Aug | Sep | Oct | Nov | Dec | |
|---|---|---|---|---|---|---|---|---|---|---|---|---|
| 2023 | -18.7 | +32.8 | ||||||||||
| 2024 | -62.6 | -18.5 | -10.7 | -5.6 | -18.1 | +12.9 | +22.1 | -9.4 | -33.9 | -14.3 | +19.4 | +297.1 |
| 2025 | +2.9 | -20.3 | +15.8 | -3.0 | +15.5 | -18.8 | -2.6 | +67.6 | +48.4 | +1.3 | -20.0 | -3.6 |
| 2026 | +2.9 | -31.0 | -19.3 | +21.8 | +19.4 | -31.9 | -31.1 | +23.0 | -13.2 | -33.1 |










