Revvity Inc. (RVTY) Stock
Key stats
- Market cap
- $17.67B
- Price / Earnings ratio
- 74.7x
- EPS (TTM)
- $2.09
- Volume
- Loading
- 52-week high
- $171.74
- 52-week low
- $81.22
- Dividend yield
- 0.18%
- Dividend amount (latest)
- $0.07
- EPS vs analyst estimate
- +3.5%Q3 FY25 · $1.18 vs $1.14
Source: third-party data provider, as of November 13, 2026
EPS estimate: analyst consensus
Compare with RVTY
Recent news
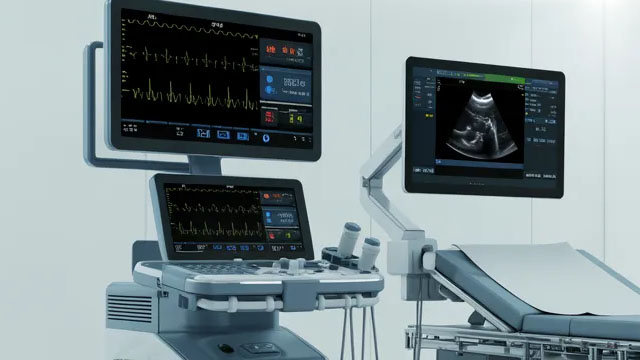
RVTY Q3 Earnings Beat Estimates on Life Sciences Strength, '26 View Up
RVTY Q3 Earnings Beat Estimates on Life Sciences Strength, '26 View Up
RVTY
Revvity Faced Off With 'Elevated Investor Expectations' — And Won
Revvity Faced Off With 'Elevated Investor Expectations' — And Won
RVTY
Revvity (RVTY) Tops Q3 Earnings and Revenue Estimates
Revvity (RVTY) Tops Q3 Earnings and Revenue Estimates
RVTY
Revvity Announces Financial Results for the Third Quarter of 2026
Revvity Announces Financial Results for the Third Quarter of 2026
RVTYNews tone: automated (AI) classification of the article's content, not a price prediction.
Technical indicators
- RSI 14
- 53.11
- MACD 12/26/9
- 2.37
- EMA 9 of MACD
- 3.18
- MACD histogram
- -0.81
- SMA 50
- $149.40
- Price above SMA 50
- EMA 50
- $148.74
- Price above EMA 50
- SMA 200
- $113.57
- Price above SMA 200
- EMA 200
- $121.10
- Price above EMA 200
Calculated by Gotrade from daily closing prices, as of November 11, 2026. Technical data, not a recommendation.
Analyst ratings
Analyst consensus: Hold
Based on 8 analyst ratings
Third-party analyst opinion, not a recommendation from Gotrade.
Financials
Performance
Debt & Balance Sheet
Revenue to Profit
2025Earnings
The market is expecting earnings per share of $1.30 for this quarter. The company has not yet shared when it is announcing earnings.
Source: third-party data provider
Latest news
RVTY Q3 Earnings Beat Estimates on Life Sciences Strength, '26 View Up
RVTY Q3 Earnings Beat Estimates on Life Sciences Strength, '26 View Up
RVTYRevvity Faced Off With 'Elevated Investor Expectations' — And Won
Revvity Faced Off With 'Elevated Investor Expectations' — And Won
RVTYRevvity (RVTY) Tops Q3 Earnings and Revenue Estimates
Revvity (RVTY) Tops Q3 Earnings and Revenue Estimates
RVTYRevvity Announces Financial Results for the Third Quarter of 2026
Revvity Announces Financial Results for the Third Quarter of 2026
RVTY
Revvity Board Declares Quarterly Dividend
Revvity Board Declares Quarterly Dividend
RVTY
Revvity Gears Up to Post Q3 Earnings: What's in Store for the Stock?
Revvity Gears Up to Post Q3 Earnings: What's in Store for the Stock?
RVTY
GRAIL Q3 Earnings Ahead: Galleri Test Adoption to Drive Growth
GRAIL Q3 Earnings Ahead: Galleri Test Adoption to Drive Growth
RVTY
Will Revvity (RVTY) Beat Estimates Again in Its Next Earnings Report?
Will Revvity (RVTY) Beat Estimates Again in Its Next Earnings Report?
RVTY
Revvity (RVTY) Earnings Expected to Grow: What to Know Ahead of Next Week's Release
Revvity (RVTY) Earnings Expected to Grow: What to Know Ahead of Next Week's Release
RVTY
ELV vs. RVTY: Which Stock Is the Better Value Option?
ELV vs. RVTY: Which Stock Is the Better Value Option?
RVTYNews tone: automated (AI) classification of the article's content, not a price prediction.
About Revvity Inc.
PerkinElmer enables scientists, researchers, and clinicians to address their most critical challenges across science and healthcare. With a mission focused on innovating for a healthier world, the company delivers unique solutions to serve the diagnostics, life sciences, food, and applied markets. IT strategically partners with customers to enable earlier and more accurate insights supported by deep market knowledge and technical expertise. Its dedicated team of about 14,000 employees worldwide is passionate about helping customers work to create healthier families, improve the quality of life, and sustain the wellbeing and longevity of people globally. The Company reported revenue of approximately $3.8 billion in 2020, serves customers in 190 countries, and is a component of the S&P 500 index.
Key Executives
| Name | Title | Year Born |
|---|---|---|
| Dr. Prahlad R. Singh Ph.D. | CEO, President & Director | 1965 |
| Mr. Maxwell Krakowiak | Senior VP & CFO | 1990 |
| Mr. Tajinder S. Vohra | Senior Vice President of Global Operations | 1966 |
| Mr. Joel S. Goldberg | Senior VP of Administration, General Counsel & Secretary | 1969 |
| Ms. Miriame Victor | Senior Vice President & Chief Business Officer | 1981 |
| Ms. Anita Gonzales | Chief Accounting Officer, VP & Controller | 1976 |
| Mr. Bryan A. Kipp | Senior VP of Technology & Licensing | — |
| Dr. Madhuri Hegde FACMG, Ph.D. | Senior VP & Chief Scientific Officer | — |
| Mr. Stephen Barr Willoughby | Senior VP of Investor Relations & Head of ESG | — |
| Ms. Magali Four | Senior VP and Chief People & Culture Officer | — |
Fundamentals
Valuation
Profitability
Trading
Dividend
Source: third-party data provider, as of November 13, 2026
Technical indicators
- RSI 14
- 53.11
- MACD 12/26/9
- 2.37
- EMA 9 of MACD
- 3.18
- MACD histogram
- -0.81
- SMA 50
- $149.40
- Price above SMA 50
- EMA 50
- $148.74
- Price above EMA 50
- SMA 200
- $113.57
- Price above SMA 200
- EMA 200
- $121.10
- Price above EMA 200
Calculated by Gotrade from daily closing prices, as of November 11, 2026. Technical data, not a recommendation.
Analyst views
8 analyst ratings
Third-party analyst opinion, not a recommendation from Gotrade.
- Low
- $140.00
- Average
- $168.14
- High
- $185.00
Seasonality
Monthly price change (%)| Jan | Feb | Mar | Apr | May | Jun | Jul | Aug | Sep | Oct | Nov | Dec | |
|---|---|---|---|---|---|---|---|---|---|---|---|---|
| 2021 | -0.7 | +8.6 | ||||||||||
| 2022 | -10.4 | +3.1 | -1.5 | -14.5 | +1.2 | -2.7 | +6.3 | -16.0 | -11.1 | +7.3 | +2.3 | -1.1 |
| 2023 | -2.6 | -10.6 | +7.9 | -0.7 | -11.5 | +2.7 | +4.4 | -4.6 | -5.3 | -23.2 | +7.7 | +19.8 |
| 2024 | -2.9 | +0.3 | -2.0 | -0.8 | +6.5 | -3.6 | +22.0 | -2.0 | +6.7 | -4.7 | -4.0 | -4.4 |
| 2025 | +12.6 | -9.3 | -4.2 | -10.4 | -2.7 | +8.3 | -11.2 | +2.1 | -0.3 | +2.0 | +12.3 | -5.5 |
| 2026 | +10.9 | -8.2 | -8.3 | -1.5 | +20.6 | +10.7 | -0.3 | +11.7 | +20.8 | +5.3 | +4.4 |