
Sidus Space, Inc. Class A Common Stock (SIDU) Stock
NASDAQ · SIDU
Key stats
- Market cap
- $113.37M
- Price / Earnings ratio
- -4.3x
- EPS (TTM)
- -$14.00
- Volume
- Loading
- 52-week high
- $6.79
- 52-week low
- $0.63
Source: third-party data provider, as of October 24, 2026
Compare with SIDU
Recent news

Zacks Investment Research
Momentus vs. Sidus Space: Which Space Stock Is a Better Buy Now?
PositiveSIDUOctober 15, 2026
Zacks Investment ResearchPositive
Momentus vs. Sidus Space: Which Space Stock Is a Better Buy Now?
SIDU
Reuters
Two Sidus Space directors resign, citing governance disagreements
NegativeSIDUOctober 9, 2026
ReutersNegative
Two Sidus Space directors resign, citing governance disagreements
SIDU
MarketBeat
Sidus Space Q2 Earnings Call Highlights
SIDUAugust 14, 2026
MarketBeat
Sidus Space Q2 Earnings Call Highlights
SIDU
Stocktwits
SpaceX’s IPO Shine Fades, Taking ASTS And RKLB With It — But There Are 2 Surprise Winners This Month
SIDUJuly 21, 2026
Stocktwits
SpaceX’s IPO Shine Fades, Taking ASTS And RKLB With It — But There Are 2 Surprise Winners This Month
SIDUNews tone: automated (AI) classification of the article's content, not a price prediction.
Technical indicators
- RSI 14
- 21.28
- MACD 12/26/9
- -0.24
- EMA 9 of MACD
- -0.21
- MACD histogram
- -0.03
- SMA 50
- $1.92
- Price below SMA 50
- EMA 50
- $1.82
- Price below EMA 50
- SMA 200
- $2.75
- Price below SMA 200
- EMA 200
- $2.31
- Price below EMA 200
Calculated by Gotrade from daily closing prices, as of October 22, 2026. Technical data, not a recommendation.
Analyst ratings
No analyst data available
Financials
Performance
No data available
Debt & Balance Sheet
No data available
Revenue to Profit
No data available
Earnings
No data available
Source: third-party data provider
Latest news
Zacks Investment Research
Momentus vs. Sidus Space: Which Space Stock Is a Better Buy Now?
PositiveSIDUOctober 15, 2026
Zacks Investment ResearchPositive
Momentus vs. Sidus Space: Which Space Stock Is a Better Buy Now?
SIDUReuters
Two Sidus Space directors resign, citing governance disagreements
NegativeSIDUOctober 9, 2026
ReutersNegative
Two Sidus Space directors resign, citing governance disagreements
SIDUMarketBeat
Sidus Space Q2 Earnings Call Highlights
SIDUAugust 14, 2026
MarketBeat
Sidus Space Q2 Earnings Call Highlights
SIDUStocktwits
SpaceX’s IPO Shine Fades, Taking ASTS And RKLB With It — But There Are 2 Surprise Winners This Month
SIDUJuly 21, 2026
Stocktwits
SpaceX’s IPO Shine Fades, Taking ASTS And RKLB With It — But There Are 2 Surprise Winners This Month
SIDU
MarketBeat
3 Small-Cap Stocks Getting a Russell 2000 Rebalance Boost
SIDUJune 21, 2026
MarketBeat
3 Small-Cap Stocks Getting a Russell 2000 Rebalance Boost
SIDU
Stocktwits
ASTS, RDW, RKTO, SIDU, MNTS, SPCE Stocks In Focus As Short Seller Says Space Sector Faces Reality Check After SpaceX Listing
SIDUJune 12, 2026
Stocktwits
ASTS, RDW, RKTO, SIDU, MNTS, SPCE Stocks In Focus As Short Seller Says Space Sector Faces Reality Check After SpaceX Listing
SIDU
Stocktwits
RKLB, LUNR, RDW Jump Premarket As Musk Pitches AI Satellites, Orbital Data Centers — Analyst Says The Odds Are Just 7%
SIDUJune 9, 2026
Stocktwits
RKLB, LUNR, RDW Jump Premarket As Musk Pitches AI Satellites, Orbital Data Centers — Analyst Says The Odds Are Just 7%
SIDU
Stocktwits
ASTS, RKLB, RDW, SIDU Slip Overnight: Retail Hopes For SpaceX-Fueled S&P 500 Buying Frenzy Take A Hit
SIDUJune 5, 2026
Stocktwits
ASTS, RKLB, RDW, SIDU Slip Overnight: Retail Hopes For SpaceX-Fueled S&P 500 Buying Frenzy Take A Hit
SIDU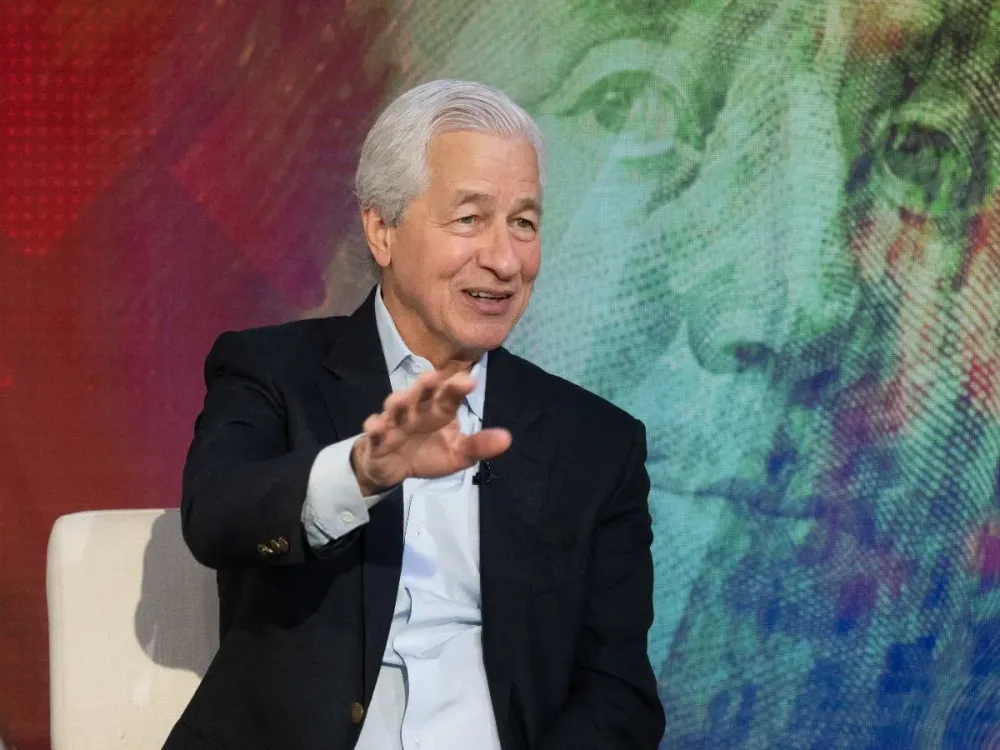
Stocktwits
RKLB, LUNR, FLY, SIDU Reverse Losses Overnight: Jamie Dimon Takes SpaceX IPO Pitch To 2,500 Wealthy Clients This Week
SIDUJune 4, 2026
Stocktwits
RKLB, LUNR, FLY, SIDU Reverse Losses Overnight: Jamie Dimon Takes SpaceX IPO Pitch To 2,500 Wealthy Clients This Week
SIDU
Stocktwits
ASTS, RKLB, SIDU, RDW Reverse Losses As Blue Origin CEO Vows New Glenn Return This Year — Retail Fears Ease
SIDUJune 2, 2026
Stocktwits
ASTS, RKLB, SIDU, RDW Reverse Losses As Blue Origin CEO Vows New Glenn Return This Year — Retail Fears Ease
SIDUNews tone: automated (AI) classification of the article's content, not a price prediction.
About Sidus Space, Inc. Class A Common Stock
No description available.
SectorIndustrials
IndustryAerospace & Defense
Employees99
CEOMs. Carol M. Craig
IPO DateDec 14, 2021
HeadquartersMerritt Island, FL
Key Executives
| Name | Title | Year Born |
|---|---|---|
| Ms. Carol M. Craig | Founder, President, CEO & Chairwoman | 1968 |
| Mr. Alan Khalili | Chief Financial Officer | — |
| Patrick Butler | Chief Operating Officer | — |
| Mr. Val Ojdanic | Chief Technology Officer | — |
| Matthew Fiore | Senior Vice President of Business Development & Sales | — |
| Mr. John Roy | Chief Business & People Officer | — |
| Mr. Jim Larson | Senior Vice President of AI Strategic Initiatives | — |
Fundamentals
Valuation
Price-to-sales ratio34.99
Price-to-book value0.63
Profitability
Return on Equity-35.00%
Return on Assets-31.00%
Return on Sales-966.00%
Gross margin (latest quarter)-108.00%
EBITDA$-23.79M
Trading
Average volume4,049,949
Source: third-party data provider, as of October 24, 2026
Technical indicators
- RSI 14
- 21.28
- MACD 12/26/9
- -0.24
- EMA 9 of MACD
- -0.21
- MACD histogram
- -0.03
- SMA 50
- $1.92
- Price below SMA 50
- EMA 50
- $1.82
- Price below EMA 50
- SMA 200
- $2.75
- Price below SMA 200
- EMA 200
- $2.31
- Price below EMA 200
Calculated by Gotrade from daily closing prices, as of October 22, 2026. Technical data, not a recommendation.
Analyst views
No analyst data available
Seasonality
Monthly price change (%)| Jan | Feb | Mar | Apr | May | Jun | Jul | Aug | Sep | Oct | Nov | Dec | |
|---|---|---|---|---|---|---|---|---|---|---|---|---|
| 2021 | -13.7 | |||||||||||
| 2022 | +7.5 | -52.7 | -23.2 | -31.1 | -20.9 | +79.3 | +13.9 | -17.0 | -21.0 | -21.3 | +0.0 | -35.1 |
| 2023 | -59.8 | +91.5 | -37.3 | -54.1 | -15.6 | -12.1 | -7.5 | -12.5 | -3.8 | -34.3 | -39.2 | +66.5 |
| 2024 | -31.1 | +99.6 | -45.0 | +6.0 | -17.8 | -10.7 | +14.3 | +39.3 | -6.0 | -15.4 | -35.6 | +202.5 |
| 2025 | -18.7 | -18.5 | -20.0 | +11.3 | -11.4 | +21.8 | -34.8 | +9.6 | -14.0 | +3.7 | -34.6 | +398.4 |
| 2026 | -35.3 | -24.4 | +14.3 | +56.2 | +45.3 | -36.7 | -35.5 | +9.0 | -14.6 | -37.1 |
Compare stocks
Market cap
$113.37M
-
-
-
Price / Earnings ratio
-4.30
-
-
-
Price / Sales ratio
34.99
-
-
-
Dividend yield
0.00%
-
-
-
Average volume
4,049,949
-
-
-
Earnings per share
$-14.00
-
-
-










