
SELLAS Life Sciences Group, Inc. Common Stock (SLS) Stock
NASDAQ · SLS
Key stats
- Market cap
- $1.70B
- Price / Earnings ratio
- -52.1x
- EPS (TTM)
- -$0.21
- Volume
- Loading
- 52-week high
- $15.88
- 52-week low
- $1.39
Source: third-party data provider, as of November 13, 2026
Compare with SLS
Recent news
Stocktwits
CAPR vs IBRX vs SLS vs IOVA: Whose Insiders Cashed Out The Most — And Who Bought Before A 5X Surge?
SLSNovember 12, 2026
Stocktwits
CAPR vs IBRX vs SLS vs IOVA: Whose Insiders Cashed Out The Most — And Who Bought Before A 5X Surge?
SLS
Stocktwits
SLS Stock Rises After-Hours: State Street Reveals Over 5% Stake — And One Fund Manager Boosted Holdings By Nearly 1,000%
SLSNovember 11, 2026
Stocktwits
SLS Stock Rises After-Hours: State Street Reveals Over 5% Stake — And One Fund Manager Boosted Holdings By Nearly 1,000%
SLS
Stocktwits
SLS Stock Rises Overnight: Retail Bets The Regal Wait Is Almost Over — Here’s What Wall Street Expects From Earnings
SLSNovember 10, 2026
Stocktwits
SLS Stock Rises Overnight: Retail Bets The Regal Wait Is Almost Over — Here’s What Wall Street Expects From Earnings
SLSStocktwits
SLS Stock Rises Overnight Despite Citi’s 64% Stake Cut — Retail Bulls Say SLS009 Alone Could Outvalue Sellas
SLSNovember 5, 2026
Stocktwits
SLS Stock Rises Overnight Despite Citi’s 64% Stake Cut — Retail Bulls Say SLS009 Alone Could Outvalue Sellas
SLSTechnical indicators
- RSI 14
- 37.60
- MACD 12/26/9
- -0.91
- EMA 9 of MACD
- -0.74
- MACD histogram
- -0.17
- SMA 50
- $11.27
- Price below SMA 50
- EMA 50
- $10.75
- Price below EMA 50
- SMA 200
- $8.74
- Price below SMA 200
- EMA 200
- $8.38
- Price above EMA 200
Calculated by Gotrade from daily closing prices, as of November 11, 2026. Technical data, not a recommendation.
Analyst ratings
No analyst data available
Financials
Performance
Revenue
Net income
Net margin %
2021
2022
2023
2024
2025
9M6M3M0
Debt & Balance Sheet
Total assets
Total liabilities
2021
2022
2023
2024
2025
94M62M31M0
Revenue to Profit
2025$0.0
Revenue$0.0
Cost of revenue$0.0
Gross profit$0.0
Operating expenses$-26.9M
Net incomeEarnings
No data available
Source: third-party data provider
Latest news
Stocktwits
CAPR vs IBRX vs SLS vs IOVA: Whose Insiders Cashed Out The Most — And Who Bought Before A 5X Surge?
SLSNovember 12, 2026
Stocktwits
CAPR vs IBRX vs SLS vs IOVA: Whose Insiders Cashed Out The Most — And Who Bought Before A 5X Surge?
SLSStocktwits
SLS Stock Rises After-Hours: State Street Reveals Over 5% Stake — And One Fund Manager Boosted Holdings By Nearly 1,000%
SLSNovember 11, 2026
Stocktwits
SLS Stock Rises After-Hours: State Street Reveals Over 5% Stake — And One Fund Manager Boosted Holdings By Nearly 1,000%
SLSStocktwits
SLS Stock Rises Overnight: Retail Bets The Regal Wait Is Almost Over — Here’s What Wall Street Expects From Earnings
SLSNovember 10, 2026
Stocktwits
SLS Stock Rises Overnight: Retail Bets The Regal Wait Is Almost Over — Here’s What Wall Street Expects From Earnings
SLSStocktwits
SLS Stock Rises Overnight Despite Citi’s 64% Stake Cut — Retail Bulls Say SLS009 Alone Could Outvalue Sellas
SLSNovember 5, 2026
Stocktwits
SLS Stock Rises Overnight Despite Citi’s 64% Stake Cut — Retail Bulls Say SLS009 Alone Could Outvalue Sellas
SLSStocktwits
Sellas To Present SLS009 Data At American Society of Hematology – Initial Results Of Therapy In Newly Diagnosed AML Patients Expected In Q4
SLSNovember 4, 2026
Stocktwits
Sellas To Present SLS009 Data At American Society of Hematology – Initial Results Of Therapy In Newly Diagnosed AML Patients Expected In Q4
SLSStocktwits
SLS Stock Snaps 4-Day Slide As Retail Eyes ASH Abstracts — Fresh Filings Reveal Bigger Swiss, Arizona Pension Bets
SLSNovember 4, 2026
Stocktwits
SLS Stock Snaps 4-Day Slide As Retail Eyes ASH Abstracts — Fresh Filings Reveal Bigger Swiss, Arizona Pension Bets
SLSStocktwits
SLS Stock Hits Over 1-Month Low: Retail Bulls Double Down Before Cancer Data — Fresh Filings Show Q3 Stake Hikes Of Over 400%
SLSNovember 3, 2026
Stocktwits
SLS Stock Hits Over 1-Month Low: Retail Bulls Double Down Before Cancer Data — Fresh Filings Show Q3 Stake Hikes Of Over 400%
SLS
Stocktwits
SLS, IBRX, IOVA End October In Red: Merck And AstraZeneca Earnings Put Cancer Bets And Buyout Hopes In Focus
SLSNovember 2, 2026
Stocktwits
SLS, IBRX, IOVA End October In Red: Merck And AstraZeneca Earnings Put Cancer Bets And Buyout Hopes In Focus
SLSStocktwits
SLS, IOVA, IBRX Slump In October As Biotech Stocks Hold Steady: Virginia Pension Fund Raised Stakes In All 3
SLSOctober 30, 2026
Stocktwits
SLS, IOVA, IBRX Slump In October As Biotech Stocks Hold Steady: Virginia Pension Fund Raised Stakes In All 3
SLS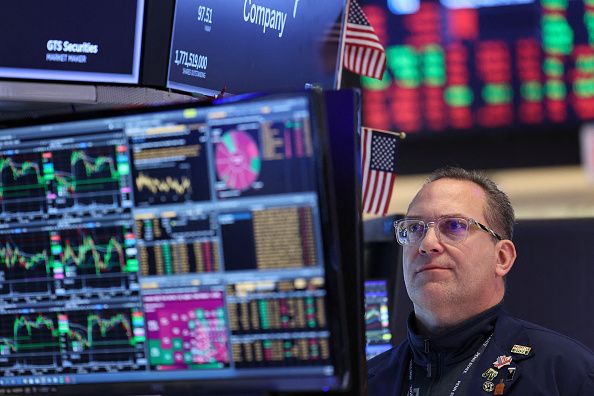
Stocktwits
Dow, S&P 500, Nasdaq Futures Fall As Weak Tech Earnings Trigger Selloff: INTC, IOVA, SLS, AMZN Stocks In Focus
SLSOctober 30, 2026
Stocktwits
Dow, S&P 500, Nasdaq Futures Fall As Weak Tech Earnings Trigger Selloff: INTC, IOVA, SLS, AMZN Stocks In Focus
SLSAbout SELLAS Life Sciences Group, Inc. Common Stock
No description available.
SectorHealthcare
IndustryBiotechnology
Employees13
CEODr. Angelos M. Stergiou M.D., ScD h.c.
IPO DateDec 29, 2017
HeadquartersNew York, NY
Key Executives
| Name | Title | Year Born |
|---|---|---|
| Dr. Angelos M. Stergiou M.D., ScD h.c. | Founder, President, CEO & Director | 1976 |
| Mr. John Thomas Burns CPA | Senior VP & CFO | 1985 |
| Dr. Dragan Cicic M.D., MBA | Senior VP & Chief Development Officer | 1963 |
| Ms. Stacy E. Yeung | VP, General Counsel & Corporate Secretary | — |
| Mr. Andrew Elnatan | Senior VP of Regulatory Affairs, CMC & Quality | — |
Fundamentals
Valuation
Price-to-book value12.28
Profitability
Return on Equity-36.00%
Return on Assets-33.00%
EBITDA$-31.85M
Trading
Average volume7,581,610
Source: third-party data provider, as of November 13, 2026
Technical indicators
- RSI 14
- 37.60
- MACD 12/26/9
- -0.91
- EMA 9 of MACD
- -0.74
- MACD histogram
- -0.17
- SMA 50
- $11.27
- Price below SMA 50
- EMA 50
- $10.75
- Price below EMA 50
- SMA 200
- $8.74
- Price below SMA 200
- EMA 200
- $8.38
- Price above EMA 200
Calculated by Gotrade from daily closing prices, as of November 11, 2026. Technical data, not a recommendation.
Analyst views
No analyst data available
Seasonality
Monthly price change (%)| Jan | Feb | Mar | Apr | May | Jun | Jul | Aug | Sep | Oct | Nov | Dec | |
|---|---|---|---|---|---|---|---|---|---|---|---|---|
| 2021 | -9.8 | -12.1 | ||||||||||
| 2022 | -8.9 | +9.9 | +9.2 | -34.5 | +7.0 | -20.4 | +16.4 | +21.9 | -33.3 | +131.7 | -50.3 | -9.2 |
| 2023 | +30.2 | -48.8 | -8.9 | -13.0 | +15.4 | -7.1 | +5.8 | -10.4 | +9.3 | -38.2 | +9.5 | -1.9 |
| 2024 | -28.9 | +68.3 | +1.0 | +15.9 | +10.2 | -16.2 | -1.7 | +4.0 | -0.8 | -2.5 | -5.0 | -10.3 |
| 2025 | +51.4 | -20.3 | -6.9 | +42.2 | +5.6 | +38.6 | -23.6 | +15.7 | -12.0 | +7.7 | -9.5 | +151.3 |
| 2026 | -13.3 | +24.2 | -16.2 | +17.6 | +88.8 | +62.7 | -24.6 | +18.9 | -6.9 | -14.6 | -1.5 |
Compare stocks
Market cap
$1.70B
-
-
-
Price / Earnings ratio
-52.10
-
-
-
Price / Sales ratio
-
-
-
Dividend yield
0.00%
-
-
-
Average volume
7,581,610
-
-
-
Earnings per share
$-0.21
-
-
-


















