
Stereotaxis, Inc. Common Stock (STXS) Stock
AMEX · STXS
Key stats
- Market cap
- $90.75M
- Price / Earnings ratio
- -4.4x
- EPS (TTM)
- -$0.24
- Volume
- Loading
- 52-week high
- $2.89
- 52-week low
- $0.80
Source: third-party data provider, as of November 13, 2026
Compare with STXS
Recent news

MarketBeat
Stereotaxis Q2 Earnings Call Highlights
STXSAugust 12, 2026
MarketBeat
Stereotaxis Q2 Earnings Call Highlights
STXS
Zacks Investment Research
Stereotaxis Inc. (STXS) Reports Q2 Loss, Lags Revenue Estimates
STXSAugust 11, 2026
Zacks Investment Research
Stereotaxis Inc. (STXS) Reports Q2 Loss, Lags Revenue Estimates
STXS
MarketBeat
Stereotaxis Q1 Earnings Call Highlights
STXSMay 16, 2026
MarketBeat
Stereotaxis Q1 Earnings Call Highlights
STXS
Zacks Investment Research
Stereotaxis Inc. (STXS) Reports Q1 Loss, Lags Revenue Estimates
STXSMay 12, 2026
Zacks Investment Research
Stereotaxis Inc. (STXS) Reports Q1 Loss, Lags Revenue Estimates
STXSTechnical indicators
- RSI 14
- 39.44
- MACD 12/26/9
- -0.04
- EMA 9 of MACD
- -0.06
- MACD histogram
- 0.02
- SMA 50
- $1.15
- Price below SMA 50
- EMA 50
- $1.13
- Price below EMA 50
- SMA 200
- $1.64
- Price below SMA 200
- EMA 200
- $1.63
- Price below EMA 200
Calculated by Gotrade from daily closing prices, as of November 11, 2026. Technical data, not a recommendation.
Analyst ratings
Analyst consensus: Buy
Based on 2 analyst ratings
Strong Sell0
Sell0
Hold0
Buy2
Strong Buy0
Third-party analyst opinion, not a recommendation from Gotrade.
Financials
Performance
Revenue
Net income
Net margin %
2021
2022
2023
2024
2025
42M28M14M0
Debt & Balance Sheet
Total assets
Total liabilities
2021
2022
2023
2024
2025
73M48M24M0
Revenue to Profit
2025$32.4M
Revenue$0.0
Cost of revenue$17.1M
Gross profit$0.0
Operating expenses$-21.6M
Net incomeEarnings
No data available
Source: third-party data provider
Latest news
MarketBeat
Stereotaxis Q2 Earnings Call Highlights
STXSAugust 12, 2026
MarketBeat
Stereotaxis Q2 Earnings Call Highlights
STXSZacks Investment Research
Stereotaxis Inc. (STXS) Reports Q2 Loss, Lags Revenue Estimates
STXSAugust 11, 2026
Zacks Investment Research
Stereotaxis Inc. (STXS) Reports Q2 Loss, Lags Revenue Estimates
STXSMarketBeat
Stereotaxis Q1 Earnings Call Highlights
STXSMay 16, 2026
MarketBeat
Stereotaxis Q1 Earnings Call Highlights
STXSZacks Investment Research
Stereotaxis Inc. (STXS) Reports Q1 Loss, Lags Revenue Estimates
STXSMay 12, 2026
Zacks Investment Research
Stereotaxis Inc. (STXS) Reports Q1 Loss, Lags Revenue Estimates
STXS
Zacks Investment Research
Stereotaxis Stock Up on First U.S. MAGiC Procedures Post Approval
STXSApril 23, 2026
Zacks Investment Research
Stereotaxis Stock Up on First U.S. MAGiC Procedures Post Approval
STXS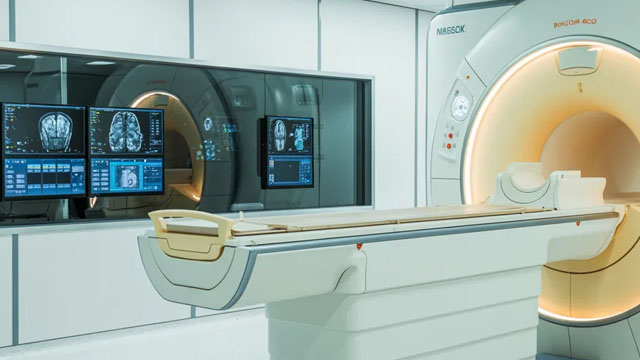
Zacks Investment Research
STXS to Acquire Robocath to Lead in Endovascular Robotics Market
STXSApril 17, 2026
Zacks Investment Research
STXS to Acquire Robocath to Lead in Endovascular Robotics Market
STXS
Zacks Investment Research
STXS Gains on FDA Nod for Synchrony System, Expands Digital Surgery
STXSApril 7, 2026
Zacks Investment Research
STXS Gains on FDA Nod for Synchrony System, Expands Digital Surgery
STXS
Zacks Investment Research
Stereotaxis Inc. (STXS) Reports Q4 Loss, Lags Revenue Estimates
STXSMarch 9, 2026
Zacks Investment Research
Stereotaxis Inc. (STXS) Reports Q4 Loss, Lags Revenue Estimates
STXS
MarketBeat
3 Underrated Robotics Stocks Poised for Huge Gains
STXSDecember 15, 2025
MarketBeat
3 Underrated Robotics Stocks Poised for Huge Gains
STXS
Zacks Investment Research
3 Promising Surgical Robotics Stocks to Keep an Eye on in 2025
STXSMarch 26, 2025
Zacks Investment Research
3 Promising Surgical Robotics Stocks to Keep an Eye on in 2025
STXSAbout Stereotaxis, Inc. Common Stock
No description available.
SectorHealthcare
IndustryMedical Instruments & Supplies
Employees131
CEODr. David Leo Fischel C.A.I.A., C.F.A., C.P.A., M.B.A.
IPO DateAug 12, 2004
HeadquartersSaint Louis, MO
Key Executives
| Name | Title | Year Born |
|---|---|---|
| Dr. David Leo Fischel C.A.I.A., C.F.A., C.P.A., M.B.A. | CEO & Chairman | 1987 |
| Ms. Kimberly R. Peery CPA | Chief Financial Officer | 1969 |
| Mr. Keith Galloway | Vice President of Operations | — |
| Ms. Patricia S. Williams Esq. | General Counsel & Secretary | 1967 |
Fundamentals
Valuation
Price-to-sales ratio3.83
Price-to-book value8.43
PEG ratio1.31
Profitability
Return on Equity-204.00%
Return on Assets-46.00%
Return on Sales-74.00%
Gross margin (latest quarter)58.49%
EBITDA$-20.75M
Trading
Average volume763,187
Source: third-party data provider, as of November 13, 2026
Technical indicators
- RSI 14
- 39.44
- MACD 12/26/9
- -0.04
- EMA 9 of MACD
- -0.06
- MACD histogram
- 0.02
- SMA 50
- $1.15
- Price below SMA 50
- EMA 50
- $1.13
- Price below EMA 50
- SMA 200
- $1.64
- Price below SMA 200
- EMA 200
- $1.63
- Price below EMA 200
Calculated by Gotrade from daily closing prices, as of November 11, 2026. Technical data, not a recommendation.
Analyst views
2 analyst ratings
Third-party analyst opinion, not a recommendation from Gotrade.
Analyst consensus:Buy
100% Buy
0% Hold
0% Sell
Analyst price target
- Low
- $2.00
- Average
- $2.50
- High
- $3.00
Seasonality
Monthly price change (%)| Jan | Feb | Mar | Apr | May | Jun | Jul | Aug | Sep | Oct | Nov | Dec | |
|---|---|---|---|---|---|---|---|---|---|---|---|---|
| 2021 | -11.7 | +3.3 | ||||||||||
| 2022 | -14.4 | -15.5 | -19.3 | -32.6 | -19.9 | -4.7 | +13.0 | -1.4 | -13.0 | +4.5 | +25.9 | -12.7 |
| 2023 | +3.8 | +15.9 | -20.6 | -16.2 | +29.0 | -32.6 | +0.6 | +14.1 | -13.2 | -3.2 | +10.0 | -1.1 |
| 2024 | +8.0 | +32.9 | -3.3 | -8.9 | -19.9 | -4.2 | +13.0 | +21.8 | -8.9 | +2.6 | +23.2 | -6.2 |
| 2025 | +5.7 | -13.1 | -9.3 | +17.0 | +5.4 | -4.9 | +6.6 | +29.7 | +14.8 | -7.3 | -11.5 | -1.7 |
| 2026 | -5.6 | -2.3 | -17.1 | +1.1 | +2.6 | -11.3 | -28.8 | +8.3 | -10.2 | -28.3 | +2.3 |
Compare stocks
Market cap
$90.75M
-
-
-
Price / Earnings ratio
-4.40
-
-
-
Price / Sales ratio
3.83
-
-
-
Dividend yield
0.00%
-
-
-
Average volume
763,187
-
-
-
Earnings per share
$-0.24
-
-
-