
Silvercorp Metals Inc. Common Shares (SVM) Stock
AMEX · SVM
Key stats
- Market cap
- $2.04B
- Price / Earnings ratio
- 42.8x
- EPS (TTM)
- $0.21
- Volume
- Loading
- 52-week high
- $15.77
- 52-week low
- $6.11
Source: third-party data provider, as of November 13, 2026
Compare with SVM
Recent news
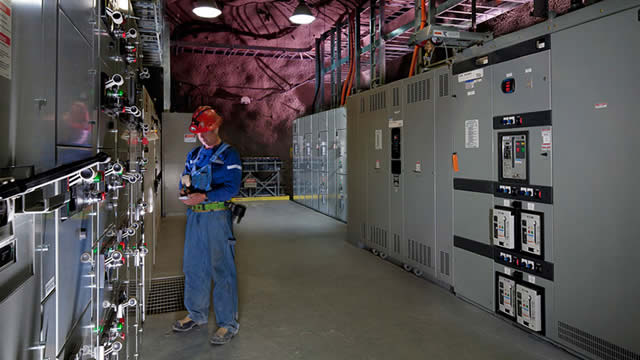
Zacks Investment Research
Analysts Estimate Silvercorp (SVM) to Report a Decline in Earnings: What to Look Out for
NegativeSVMOctober 29, 2026
Zacks Investment ResearchNegative
Analysts Estimate Silvercorp (SVM) to Report a Decline in Earnings: What to Look Out for
SVM
Business Wire
SVM Investors with $100,000 in Losses Have Opportunity to Join Silvercorp Metals Inc. Fraud Investigation with SBS Law
NeutralSVMOctober 28, 2026
Business WireNeutral
SVM Investors with $100,000 in Losses Have Opportunity to Join Silvercorp Metals Inc. Fraud Investigation with SBS Law
SVM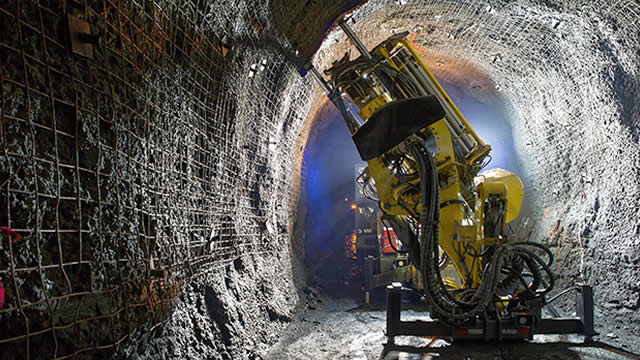
The Motley Fool
Silvercorp's 2026 Outlook: Expanding Global Production Assets to Reduce Jurisdiction Risks
PositiveSVMOctober 9, 2026
The Motley FoolPositive
Silvercorp's 2026 Outlook: Expanding Global Production Assets to Reduce Jurisdiction Risks
SVM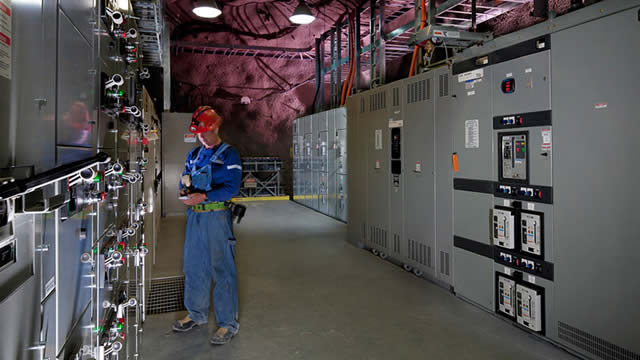
MarketBeat
Silvercorp Metals Maps Global Growth With Ecuador and Kyrgyzstan Mine Builds
PositiveSVMOctober 1, 2026
MarketBeatPositive
Silvercorp Metals Maps Global Growth With Ecuador and Kyrgyzstan Mine Builds
SVMNews tone: automated (AI) classification of the article's content, not a price prediction.
Technical indicators
- RSI 14
- 49.24
- MACD 12/26/9
- -0.33
- EMA 9 of MACD
- -0.53
- MACD histogram
- 0.20
- SMA 50
- $10.32
- Price below SMA 50
- EMA 50
- $9.86
- Price below EMA 50
- SMA 200
- $11.14
- Price below SMA 200
- EMA 200
- $10.50
- Price below EMA 200
Calculated by Gotrade from daily closing prices, as of November 11, 2026. Technical data, not a recommendation.
Analyst ratings
No analyst data available
Financials
Performance
Revenue
Net income
Net margin %
2022
2023
2024
2025
2026
526M347M174M0
Debt & Balance Sheet
Total assets
Total liabilities
2022
2023
2024
2025
2026
2B1B580M0
Revenue to Profit
2026$438.1M
Revenue$0.0
Cost of revenue$265.8M
Gross profit$0.0
Operating expenses$-9.9M
Net incomeEarnings
No data available
Source: third-party data provider
Latest news
Zacks Investment Research
Analysts Estimate Silvercorp (SVM) to Report a Decline in Earnings: What to Look Out for
NegativeSVMOctober 29, 2026
Zacks Investment ResearchNegative
Analysts Estimate Silvercorp (SVM) to Report a Decline in Earnings: What to Look Out for
SVMBusiness Wire
SVM Investors with $100,000 in Losses Have Opportunity to Join Silvercorp Metals Inc. Fraud Investigation with SBS Law
NeutralSVMOctober 28, 2026
Business WireNeutral
SVM Investors with $100,000 in Losses Have Opportunity to Join Silvercorp Metals Inc. Fraud Investigation with SBS Law
SVMThe Motley Fool
Silvercorp's 2026 Outlook: Expanding Global Production Assets to Reduce Jurisdiction Risks
PositiveSVMOctober 9, 2026
The Motley FoolPositive
Silvercorp's 2026 Outlook: Expanding Global Production Assets to Reduce Jurisdiction Risks
SVMMarketBeat
Silvercorp Metals Maps Global Growth With Ecuador and Kyrgyzstan Mine Builds
PositiveSVMOctober 1, 2026
MarketBeatPositive
Silvercorp Metals Maps Global Growth With Ecuador and Kyrgyzstan Mine Builds
SVM
Zacks Investment Research
SVM Q1 Earnings Call Focuses on Q2 Output View Amid Safety Upgrades
SVMAugust 12, 2026
Zacks Investment Research
SVM Q1 Earnings Call Focuses on Q2 Output View Amid Safety Upgrades
SVM
MarketBeat
Silvercorp Metals Q1 Earnings Call Highlights
SVMAugust 12, 2026
MarketBeat
Silvercorp Metals Q1 Earnings Call Highlights
SVM
Zacks Investment Research
Silvercorp (SVM) Meets Q1 Earnings Estimates
SVMAugust 11, 2026
Zacks Investment Research
Silvercorp (SVM) Meets Q1 Earnings Estimates
SVM
Zacks Investment Research
Silvercorp Metals Gears Up to Report Q1 Earnings: What's in Store?
SVMAugust 5, 2026
Zacks Investment Research
Silvercorp Metals Gears Up to Report Q1 Earnings: What's in Store?
SVM
Zacks Investment Research
Silvercorp (SVM) Earnings Expected to Grow: What to Know Ahead of Next Week's Release
SVMAugust 3, 2026
Zacks Investment Research
Silvercorp (SVM) Earnings Expected to Grow: What to Know Ahead of Next Week's Release
SVM
Zacks Investment Research
Is the Options Market Predicting a Spike in Silvercorp Metals Stock?
SVMJuly 29, 2026
Zacks Investment Research
Is the Options Market Predicting a Spike in Silvercorp Metals Stock?
SVMNews tone: automated (AI) classification of the article's content, not a price prediction.
About Silvercorp Metals Inc. Common Shares
No description available.
SectorBasic Materials
IndustrySilver
Employees372
CEODr. Rui Feng Ph.D.
IPO DateMay 2, 2005
HeadquartersVancouver, BC
Key Executives
| Name | Title | Year Born |
|---|---|---|
| Dr. Rui Feng Ph.D. | Chairman & CEO | 1963 |
| Ms. Winnie Wang | Interim Chief Financial Officer | — |
| Mr. Lon Eric Shaver B.Com., C.F.A. | President | 1970 |
| Mr. Jonathan Hoyles | General Counsel & Corporate Secretary | — |
| Mr. Lichang Peng | General Manager of China Operations | — |
| Mr. Peter Lekich | Director of Corporate Development & Investor Relations | — |
| Mr. Yongming Zhang M.Eng, M.Sc., M.Sci, P.Geo. | Vice President of Exploration | — |
| Mr. Y Wang | Chief Environment Engineer of Ying Mines | — |
| Mr. Leon Ma | Senior Resources Geologist | — |
| Luke Sun | Controller | — |
Fundamentals
Valuation
Price-to-sales ratio5.63
Price-to-book value2.06
PEG ratio0.00
Profitability
Return on Equity5.00%
Return on Assets3.00%
Return on Sales25.00%
Gross margin (latest quarter)60.11%
EBITDA$155.05M
Trading
Average volume2,520,301
Dividend
Ex dividend date5 Jun 2026
Last payment date25 Jun 2026
Source: third-party data provider, as of November 13, 2026
Technical indicators
- RSI 14
- 49.24
- MACD 12/26/9
- -0.33
- EMA 9 of MACD
- -0.53
- MACD histogram
- 0.20
- SMA 50
- $10.32
- Price below SMA 50
- EMA 50
- $9.86
- Price below EMA 50
- SMA 200
- $11.14
- Price below SMA 200
- EMA 200
- $10.50
- Price below EMA 200
Calculated by Gotrade from daily closing prices, as of November 11, 2026. Technical data, not a recommendation.
Analyst views
No analyst data available
Seasonality
Monthly price change (%)| Jan | Feb | Mar | Apr | May | Jun | Jul | Aug | Sep | Oct | Nov | Dec | |
|---|---|---|---|---|---|---|---|---|---|---|---|---|
| 2021 | -11.8 | -1.8 | ||||||||||
| 2022 | -9.5 | +11.4 | -8.4 | -18.8 | -9.6 | -11.1 | +5.6 | -12.4 | +6.9 | -3.9 | +12.9 | +0.0 |
| 2023 | +14.6 | -13.5 | +18.6 | -5.9 | -17.1 | -10.5 | +5.8 | -14.5 | -8.9 | -2.7 | +32.4 | -9.3 |
| 2024 | -6.3 | +0.0 | +32.0 | -8.7 | +24.3 | -13.4 | +11.0 | +8.3 | +24.9 | +6.8 | -28.6 | -7.1 |
| 2025 | -0.3 | +12.1 | +9.9 | -2.3 | +9.9 | +1.4 | -2.7 | +12.0 | +24.9 | -0.5 | +20.7 | +4.6 |
| 2026 | +20.7 | +39.2 | -20.8 | +8.0 | +3.3 | -21.5 | -7.0 | +30.1 | -10.3 | -25.1 | +14.1 |
Corporate actions
Upcoming
DividendQ4/26
Ex-dividend date27 Nov 2026
Payable date11 Dec 2026
Amount per share$0.01
Past
DividendQ2/26
Ex-dividend date5 Jun 2026
Payable date25 Jun 2026
Amount per share$0.01
DividendQ4/25
Ex-dividend date28 Nov 2025
Payable date12 Dec 2025
Amount per share$0.01
DividendQ2/25
Ex-dividend date6 Jun 2025
Payable date26 Jun 2025
Amount per share$0.01
DividendQ4/24
Ex-dividend date29 Nov 2024
Payable date13 Dec 2024
Amount per share$0.01
DividendQ2/24
Ex-dividend date7 Jun 2024
Payable date27 Jun 2024
Amount per share$0.01
DividendQ4/23
Ex-dividend date22 Nov 2023
Payable date15 Dec 2023
Amount per share$0.01
DividendQ2/23
Ex-dividend date9 Jun 2023
Payable date29 Jun 2023
Amount per share$0.01
DividendQ4/22
Ex-dividend date23 Nov 2022
Payable date16 Dec 2022
Amount per share$0.01
DividendQ2/22
Ex-dividend date3 Jun 2022
Payable date24 Jun 2022
Amount per share$0.01
DividendQ4/21
Ex-dividend date23 Nov 2021
Payable date15 Dec 2021
Amount per share$0.01
Compare stocks
Market cap
$2.04B
-
-
-
Price / Earnings ratio
42.80
-
-
-
Price / Sales ratio
5.63
-
-
-
Dividend yield
0.27%
-
-
-
Average volume
2,520,301
-
-
-
Earnings per share
$0.21
-
-
-










