
Invesco Solar ETF (TAN) Stock
Key stats
- Market cap
- $3.05B
- Volume
- Loading
- 52-week high
- $75.60
- 52-week low
- $39.56
Source: third-party data provider, as of November 13, 2026
Recent news

Options traders are betting heavily on these stocks ahead of election results
Options traders are betting heavily on these stocks ahead of election results
TAN
Enphase Jumps 11%, Sunrun Spikes 10% as Solar Stocks Rebound From Last Week's Earnings Rout; First Solar Climbs 5%
Enphase Jumps 11%, Sunrun Spikes 10% as Solar Stocks Rebound From Last Week's Earnings Rout; First Solar Climbs 5%
TAN
A Tale of Two Energy ETFs: How EMLP and TAN Are Worlds Apart
A Tale of Two Energy ETFs: How EMLP and TAN Are Worlds Apart
TAN
Solar Stocks Rebound as Selloff Reverses: Sunrun Surges 10%, SolarEdge and Enphase Energy Climb 5%
Solar Stocks Rebound as Selloff Reverses: Sunrun Surges 10%, SolarEdge and Enphase Energy Climb 5%
TANNews tone: automated (AI) classification of the article's content, not a price prediction.
Technical indicators
- RSI 14
- 51.82
- MACD 12/26/9
- 0.12
- EMA 9 of MACD
- -0.30
- MACD histogram
- 0.43
- SMA 50
- $44.12
- Price below SMA 50
- EMA 50
- $44.72
- Price below EMA 50
- SMA 200
- $53.71
- Price below SMA 200
- EMA 200
- $50.67
- Price below EMA 200
Calculated by Gotrade from daily closing prices, as of November 11, 2026. Technical data, not a recommendation.
Analyst ratings
No analyst data available
Financials
Performance
No data available
Debt & Balance Sheet
No data available
Revenue to Profit
No data available
Earnings
No data available
Source: third-party data provider
Latest news
Options traders are betting heavily on these stocks ahead of election results
Options traders are betting heavily on these stocks ahead of election results
TANEnphase Jumps 11%, Sunrun Spikes 10% as Solar Stocks Rebound From Last Week's Earnings Rout; First Solar Climbs 5%
Enphase Jumps 11%, Sunrun Spikes 10% as Solar Stocks Rebound From Last Week's Earnings Rout; First Solar Climbs 5%
TANA Tale of Two Energy ETFs: How EMLP and TAN Are Worlds Apart
A Tale of Two Energy ETFs: How EMLP and TAN Are Worlds Apart
TANSolar Stocks Rebound as Selloff Reverses: Sunrun Surges 10%, SolarEdge and Enphase Energy Climb 5%
Solar Stocks Rebound as Selloff Reverses: Sunrun Surges 10%, SolarEdge and Enphase Energy Climb 5%
TAN
Sunrun Sinks 5% Toward 52-Week Low Ahead of Earnings; Enphase Energy and First Solar Slip
Sunrun Sinks 5% Toward 52-Week Low Ahead of Earnings; Enphase Energy and First Solar Slip
TAN
Better Energy ETF: Global X's MLPX Targeting Oil and Gas Infrastructure vs. Invesco's Solar-Focused TAN
Better Energy ETF: Global X's MLPX Targeting Oil and Gas Infrastructure vs. Invesco's Solar-Focused TAN
TAN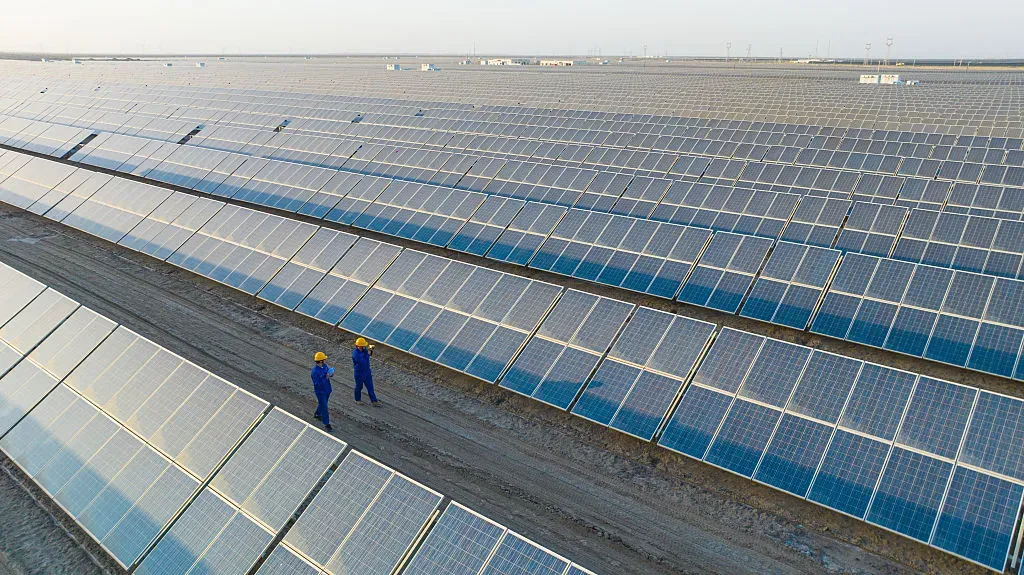
FSLR Stock Heads For Its Worst Week In Over A Month — Roth Says US Polysilicon Crackdown Could Provide A Tailwind
FSLR Stock Heads For Its Worst Week In Over A Month — Roth Says US Polysilicon Crackdown Could Provide A Tailwind
TAN
Solar Stocks Slide as High Borrowing Costs Weigh on Project Financing: First Solar Sinks 8%, SolarEdge Falls 5%, Enphase Energy Drops 4%
Solar Stocks Slide as High Borrowing Costs Weigh on Project Financing: First Solar Sinks 8%, SolarEdge Falls 5%, Enphase Energy Drops 4%
TAN
Better Energy Sector ETF: Vanguard's VDE Targeting Traditional Oil and Gas Giants vs. Invesco's Solar-Focused TAN
Better Energy Sector ETF: Vanguard's VDE Targeting Traditional Oil and Gas Giants vs. Invesco's Solar-Focused TAN
TAN
Enphase Energy Drops 5% as Solar Selling Resumes; First Solar and Sunrun Fall 4%
Enphase Energy Drops 5% as Solar Selling Resumes; First Solar and Sunrun Fall 4%
TANNews tone: automated (AI) classification of the article's content, not a price prediction.
About Invesco Solar ETF
The Invesco Solar ETF (Fund) is based on the MAC Global Solar Energy Index (Index). The Fund will invest at least 90% of its total assets in the securities, American depositary receipts (ADRs) and global depositary receipts (GDRs) that comprise the Index. The Index is comprised of companies in the solar energy industry. The index is computed using the net return, which withholds applicable taxes for non-resident investors.
Fundamentals
Trading
Dividend
Source: third-party data provider, as of November 13, 2026
Technical indicators
- RSI 14
- 51.82
- MACD 12/26/9
- 0.12
- EMA 9 of MACD
- -0.30
- MACD histogram
- 0.43
- SMA 50
- $44.12
- Price below SMA 50
- EMA 50
- $44.72
- Price below EMA 50
- SMA 200
- $53.71
- Price below SMA 200
- EMA 200
- $50.67
- Price below EMA 200
Calculated by Gotrade from daily closing prices, as of November 11, 2026. Technical data, not a recommendation.
Analyst views
No analyst data available
Seasonality
Monthly price change (%)| Jan | Feb | Mar | Apr | May | Jun | Jul | Aug | Sep | Oct | Nov | Dec | |
|---|---|---|---|---|---|---|---|---|---|---|---|---|
| 2021 | -8.7 | -10.9 | ||||||||||
| 2022 | -16.6 | +9.6 | +3.6 | -15.7 | +9.4 | +1.7 | +18.8 | +1.2 | -11.1 | -5.4 | +17.0 | -10.5 |
| 2023 | +12.0 | -10.1 | +1.4 | -5.7 | -1.6 | -0.1 | -4.0 | -13.2 | -11.3 | -15.1 | +10.4 | +11.4 |
| 2024 | -18.6 | -0.6 | +2.7 | -10.5 | +19.8 | -16.5 | +7.4 | -0.3 | +8.3 | -6.7 | -7.4 | -11.6 |
| 2025 | -2.7 | -2.6 | -2.7 | -7.9 | +12.3 | +7.7 | +4.4 | +14.0 | +6.5 | +9.0 | -0.5 | +3.1 |
| 2026 | +4.4 | +2.4 | -1.2 | +3.8 | +24.7 | -16.8 | -14.7 | -7.2 | -6.2 | -6.7 | +4.5 |
Corporate actions
Upcoming
No upcoming corporate actions for TAN










