
20 Yr Treasury ETF (TLT) Stock
Key stats
- Market cap
- $24.64B
- Volume
- Loading
- 52-week high
- $90.86
- 52-week low
- $76.43
Source: third-party data provider, as of November 5, 2026
Recent news
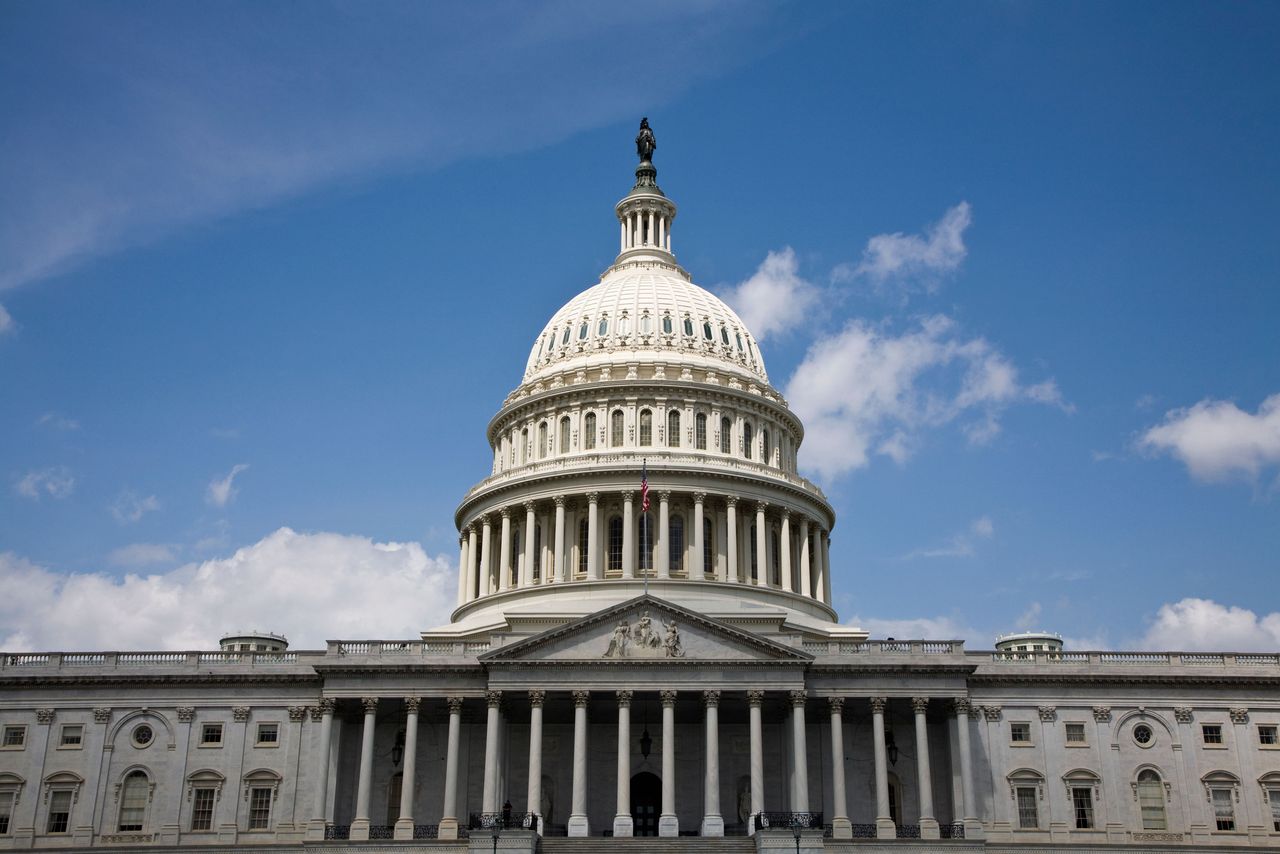
$1.2 Trillion Added To US Stocks After Midterms: Is A Slower AI Buildout Part Of The Blue Tidal Wave?
$1.2 Trillion Added To US Stocks After Midterms: Is A Slower AI Buildout Part Of The Blue Tidal Wave?
TLT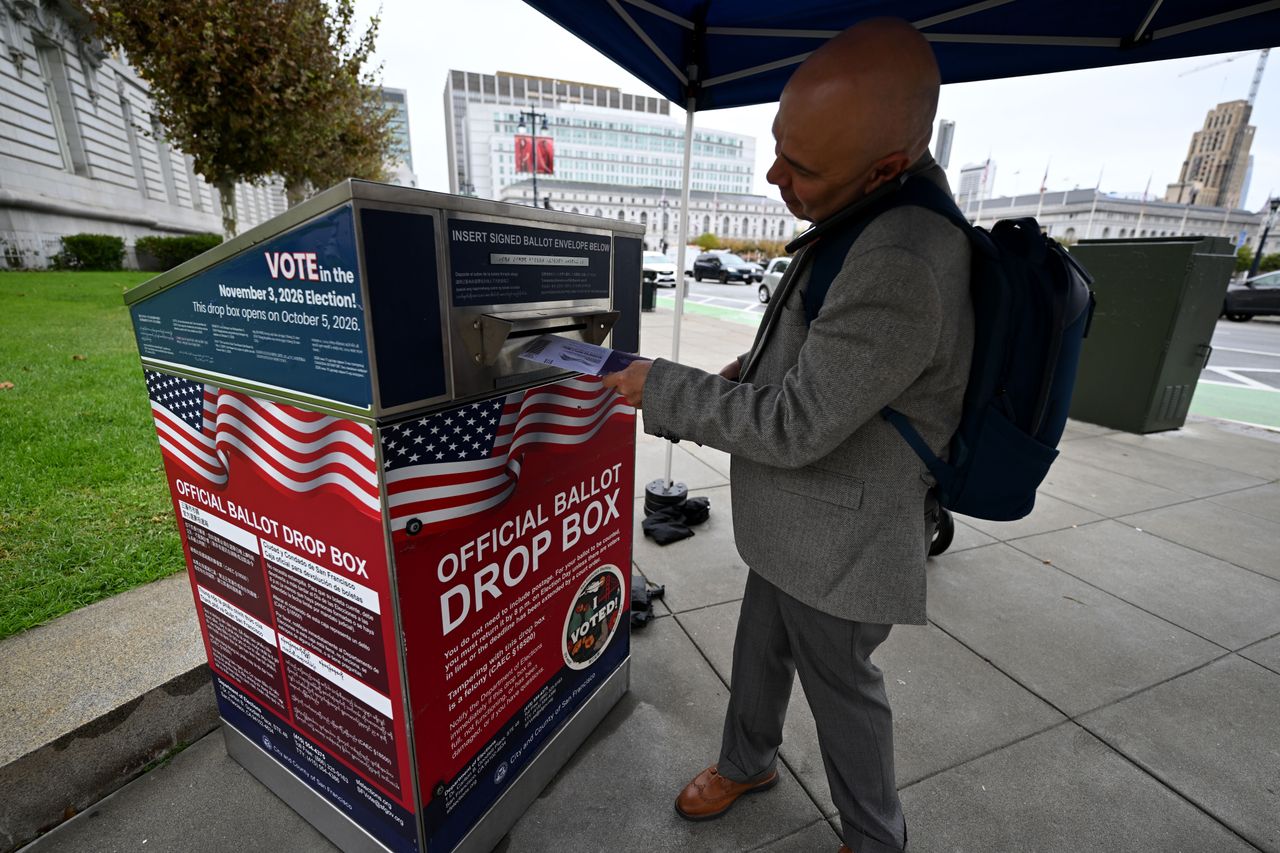
Dow, S&P 500, Nasdaq Futures Mixed After A Democratic Sweep In Midterms: NVDA, MU, SNDK, NBIS, IREN In Focus
Dow, S&P 500, Nasdaq Futures Mixed After A Democratic Sweep In Midterms: NVDA, MU, SNDK, NBIS, IREN In Focus
TLTDow, S&P 500, Nasdaq Futures Fall As Markets Weigh A Potential Democratic Sweep In Midterms: DJT, AMD, SMCI, SOXL In Focus
Dow, S&P 500, Nasdaq Futures Fall As Markets Weigh A Potential Democratic Sweep In Midterms: DJT, AMD, SMCI, SOXL In Focus
TLT
Strategy's Michael Saylor Blames These 3 Factors for Bitcoin's Recent Sluggish Performance. The Most Important Is Treasury Yields.
Strategy's Michael Saylor Blames These 3 Factors for Bitcoin's Recent Sluggish Performance. The Most Important Is Treasury Yields.
TLTNews tone: automated (AI) classification of the article's content, not a price prediction.
Technical indicators
- RSI 14
- 60.12
- MACD 12/26/9
- 0.53
- EMA 9 of MACD
- 0.34
- MACD histogram
- 0.19
- SMA 50
- $80.43
- Price above SMA 50
- EMA 50
- $80.78
- Price above EMA 50
- SMA 200
- $84.53
- Price below SMA 200
- EMA 200
- $84.10
- Price below EMA 200
Calculated by Gotrade from daily closing prices, as of November 4, 2026. Technical data, not a recommendation.
Analyst ratings
No analyst data available
Financials
Performance
No data available
Debt & Balance Sheet
No data available
Revenue to Profit
No data available
Earnings
No data available
Source: third-party data provider
Latest news
$1.2 Trillion Added To US Stocks After Midterms: Is A Slower AI Buildout Part Of The Blue Tidal Wave?
$1.2 Trillion Added To US Stocks After Midterms: Is A Slower AI Buildout Part Of The Blue Tidal Wave?
TLTDow, S&P 500, Nasdaq Futures Mixed After A Democratic Sweep In Midterms: NVDA, MU, SNDK, NBIS, IREN In Focus
Dow, S&P 500, Nasdaq Futures Mixed After A Democratic Sweep In Midterms: NVDA, MU, SNDK, NBIS, IREN In Focus
TLTDow, S&P 500, Nasdaq Futures Fall As Markets Weigh A Potential Democratic Sweep In Midterms: DJT, AMD, SMCI, SOXL In Focus
Dow, S&P 500, Nasdaq Futures Fall As Markets Weigh A Potential Democratic Sweep In Midterms: DJT, AMD, SMCI, SOXL In Focus
TLTStrategy's Michael Saylor Blames These 3 Factors for Bitcoin's Recent Sluggish Performance. The Most Important Is Treasury Yields.
Strategy's Michael Saylor Blames These 3 Factors for Bitcoin's Recent Sluggish Performance. The Most Important Is Treasury Yields.
TLT
What To Expect In Markets This Week: AAPL, PLTR, AMD, SMCI, SHOP, Earnings, Jobs Report And More
What To Expect In Markets This Week: AAPL, PLTR, AMD, SMCI, SHOP, Earnings, Jobs Report And More
TLT
Chamath Palihapitiya Sounds The Alarm On AI's $400 Billion Debt Problem — And Why Treasury Investors Should Care
Chamath Palihapitiya Sounds The Alarm On AI's $400 Billion Debt Problem — And Why Treasury Investors Should Care
TLT
The U.S. Just Borrowed a Record $839 Billion in One Week
The U.S. Just Borrowed a Record $839 Billion in One Week
TLT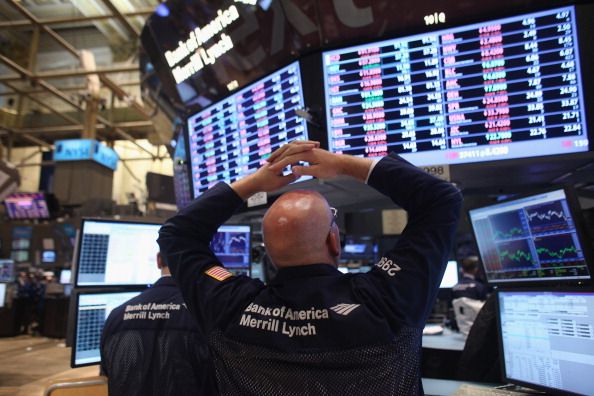
Stocktwits Weekly Spread: What Shaped Treasury Yields And The Dollar This Week
Stocktwits Weekly Spread: What Shaped Treasury Yields And The Dollar This Week
TLT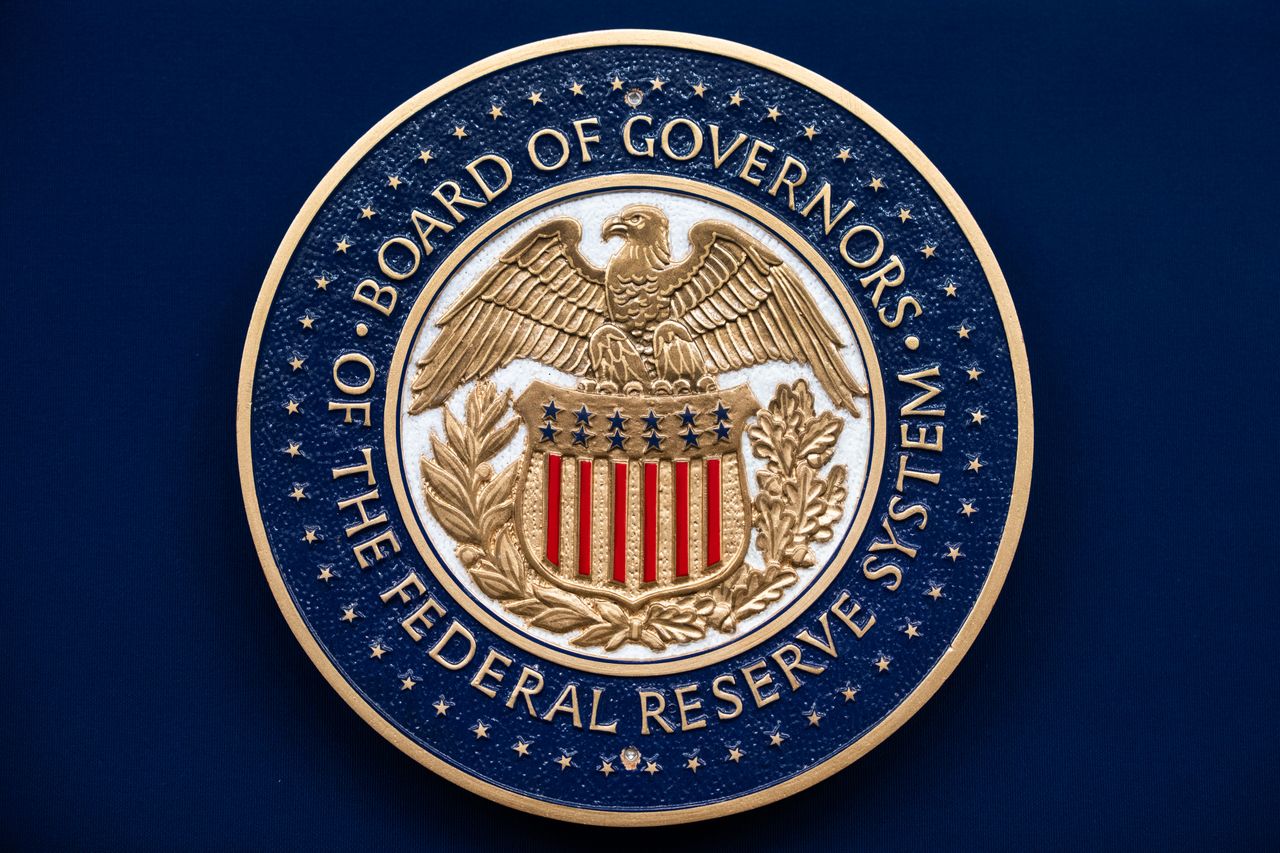
Higher Rates Ahead? Three Fed Officials Have Called For A Gradual Uptick In Interest Rates This Week
Higher Rates Ahead? Three Fed Officials Have Called For A Gradual Uptick In Interest Rates This Week
TLT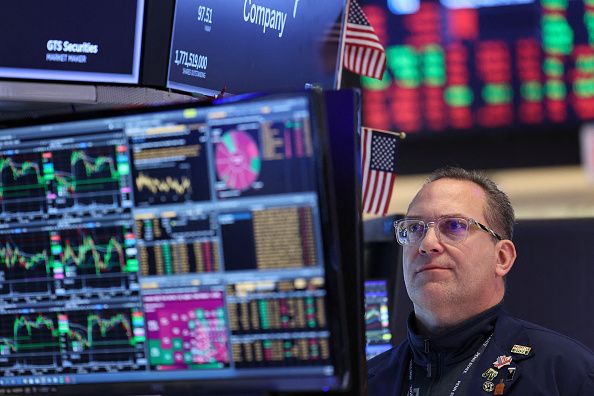
Dow, S&P 500, Nasdaq Futures Fall As Weak Tech Earnings Trigger Selloff: INTC, IOVA, SLS, AMZN Stocks In Focus
Dow, S&P 500, Nasdaq Futures Fall As Weak Tech Earnings Trigger Selloff: INTC, IOVA, SLS, AMZN Stocks In Focus
TLTNews tone: automated (AI) classification of the article's content, not a price prediction.
About 20 Yr Treasury ETF
The iShares 20+ Year Treasury Bond ETF seeks to track the investment results of an index composed of U.S. Treasury bonds with remaining maturities greater than twenty years.
Fundamentals
Trading
Dividend
Source: third-party data provider, as of November 5, 2026
Technical indicators
- RSI 14
- 60.12
- MACD 12/26/9
- 0.53
- EMA 9 of MACD
- 0.34
- MACD histogram
- 0.19
- SMA 50
- $80.43
- Price above SMA 50
- EMA 50
- $80.78
- Price above EMA 50
- SMA 200
- $84.53
- Price below SMA 200
- EMA 200
- $84.10
- Price below EMA 200
Calculated by Gotrade from daily closing prices, as of November 4, 2026. Technical data, not a recommendation.
Analyst views
No analyst data available
Seasonality
Monthly price change (%)| Jan | Feb | Mar | Apr | May | Jun | Jul | Aug | Sep | Oct | Nov | Dec | |
|---|---|---|---|---|---|---|---|---|---|---|---|---|
| 2021 | +1.5 | -2.7 | ||||||||||
| 2022 | -1.3 | -1.3 | -6.5 | -9.8 | -0.5 | -1.2 | +1.4 | -6.8 | -6.5 | -7.4 | +6.2 | -5.9 |
| 2023 | +5.6 | -6.0 | +6.0 | -0.1 | -0.1 | -0.2 | -2.0 | -1.5 | -6.5 | -3.9 | +7.6 | +6.3 |
| 2024 | -1.7 | -4.1 | +0.2 | -4.7 | +2.1 | +0.2 | +5.4 | +1.2 | +0.4 | -6.1 | +3.4 | -7.0 |
| 2025 | +0.2 | +4.8 | -1.7 | -2.2 | -2.7 | +3.6 | -1.4 | -1.4 | +4.4 | +1.1 | +0.5 | -1.8 |
| 2026 | +0.1 | +4.9 | -3.3 | -0.7 | +0.2 | +1.1 | -3.8 | +0.4 | -5.0 | +5.3 | -0.8 |










