
Global X Uranium ETF (URA) Stock
Key stats
- Market cap
- $149.30M
- Volume
- Loading
- 52-week high
- $62.28
- 52-week low
- $30.40
Source: third-party data provider, as of November 13, 2026
Recent news

Oklo Gets Final DOE Operational Clearance For Groves-1 Reactor – Retail Eyes 85% Upside By 2026-End
Oklo Gets Final DOE Operational Clearance For Groves-1 Reactor – Retail Eyes 85% Upside By 2026-End
URA
Global X ETFs Launches New Website and Largest Brand Campaign as Investors Embrace Innovation
Global X ETFs Launches New Website and Largest Brand Campaign as Investors Embrace Innovation
URA
OKLO Stock: UBS Cuts Price Target, But This Government-Backed Nuclear Project Could Be Key Catalyst
OKLO Stock: UBS Cuts Price Target, But This Government-Backed Nuclear Project Could Be Key Catalyst
URA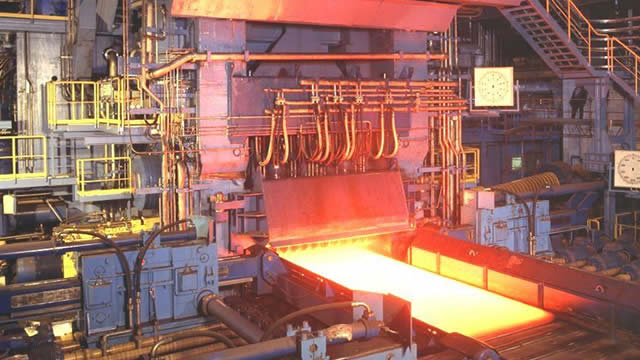
Uranium Stocks Are Rallying. Why NXE Got Initiated At Overweight.
Uranium Stocks Are Rallying. Why NXE Got Initiated At Overweight.
URANews tone: automated (AI) classification of the article's content, not a price prediction.
Technical indicators
- RSI 14
- 42.80
- MACD 12/26/9
- -1.58
- EMA 9 of MACD
- -1.76
- MACD histogram
- 0.19
- SMA 50
- $38.67
- Price below SMA 50
- EMA 50
- $37.58
- Price below EMA 50
- SMA 200
- $46.20
- Price below SMA 200
- EMA 200
- $44.36
- Price below EMA 200
Calculated by Gotrade from daily closing prices, as of November 11, 2026. Technical data, not a recommendation.
Analyst ratings
No analyst data available
Financials
Performance
No data available
Debt & Balance Sheet
No data available
Revenue to Profit
No data available
Earnings
No data available
Source: third-party data provider
Latest news
Oklo Gets Final DOE Operational Clearance For Groves-1 Reactor – Retail Eyes 85% Upside By 2026-End
Oklo Gets Final DOE Operational Clearance For Groves-1 Reactor – Retail Eyes 85% Upside By 2026-End
URAGlobal X ETFs Launches New Website and Largest Brand Campaign as Investors Embrace Innovation
Global X ETFs Launches New Website and Largest Brand Campaign as Investors Embrace Innovation
URAOKLO Stock: UBS Cuts Price Target, But This Government-Backed Nuclear Project Could Be Key Catalyst
OKLO Stock: UBS Cuts Price Target, But This Government-Backed Nuclear Project Could Be Key Catalyst
URAUranium Stocks Are Rallying. Why NXE Got Initiated At Overweight.
Uranium Stocks Are Rallying. Why NXE Got Initiated At Overweight.
URA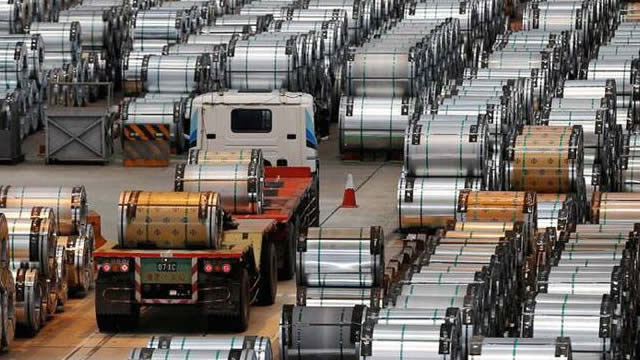
NuScale Power Drops 7% as Nuclear Stocks Hand Back the Vote Rally; Oklo Falls 5%, Centrus Energy Slides 3%
NuScale Power Drops 7% as Nuclear Stocks Hand Back the Vote Rally; Oklo Falls 5%, Centrus Energy Slides 3%
URA
Uranium ETFs Just Crashed 30 Percent While AI Power Demand Keeps Breaking Records
Uranium ETFs Just Crashed 30 Percent While AI Power Demand Keeps Breaking Records
URA
Oklo Just Made Big Progress With Small Modular Nuclear Reactor Technology. That's Great News for These 2 ETFs.
Oklo Just Made Big Progress With Small Modular Nuclear Reactor Technology. That's Great News for These 2 ETFs.
URA
Why Trump's Nuclear Deal With Saudi Arabia Could Be Good News for These 2 Uranium ETFs
Why Trump's Nuclear Deal With Saudi Arabia Could Be Good News for These 2 Uranium ETFs
URA
US-Saudi Sign Landmark Atomic Deal: A Game Changer for Nuclear ETFs?
US-Saudi Sign Landmark Atomic Deal: A Game Changer for Nuclear ETFs?
URA
5 Uranium ETFs to Buy Before Nuclear Demand Triples by 2050
5 Uranium ETFs to Buy Before Nuclear Demand Triples by 2050
URANews tone: automated (AI) classification of the article's content, not a price prediction.
About Global X Uranium ETF
The Global X Uranium ETF (URA) provides investors access to a broad range of uranium mining companies. The Global X Uranium ETF seeks to provide investment results that correspond generally to the price and yield performance, before fees and expenses, of the Solactive Global Uranium Total Return Index.
Fundamentals
Trading
Dividend
Source: third-party data provider, as of November 13, 2026
Technical indicators
- RSI 14
- 42.80
- MACD 12/26/9
- -1.58
- EMA 9 of MACD
- -1.76
- MACD histogram
- 0.19
- SMA 50
- $38.67
- Price below SMA 50
- EMA 50
- $37.58
- Price below EMA 50
- SMA 200
- $46.20
- Price below SMA 200
- EMA 200
- $44.36
- Price below EMA 200
Calculated by Gotrade from daily closing prices, as of November 11, 2026. Technical data, not a recommendation.
Analyst views
No analyst data available
Seasonality
Monthly price change (%)| Jan | Feb | Mar | Apr | May | Jun | Jul | Aug | Sep | Oct | Nov | Dec | |
|---|---|---|---|---|---|---|---|---|---|---|---|---|
| 2021 | -15.1 | -6.3 | ||||||||||
| 2022 | -14.5 | +13.6 | +8.7 | -11.0 | -4.2 | -13.8 | +13.5 | +10.8 | -11.0 | -2.0 | +5.9 | -4.1 |
| 2023 | +15.0 | -11.0 | -6.9 | +0.1 | +0.9 | +2.8 | +5.1 | +6.5 | +11.2 | +3.0 | +6.9 | -4.3 |
| 2024 | +11.8 | -14.7 | +1.9 | -4.5 | +8.7 | -8.3 | +7.0 | |||||
| 2026 | +2.0 | -14.2 | +14.5 | -9.1 | -13.5 | -9.5 | +11.5 | -9.3 | -14.8 | +0.7 |
Corporate actions
Upcoming
No upcoming corporate actions for URA










