
Vanguard Small-cap Index ETF (VB) Stock
Key stats
- Market cap
- $43.65B
- Volume
- Loading
- 52-week high
- $309.51
- 52-week low
- $241.17
Source: third-party data provider, as of November 13, 2026
Recent news

MDGL Stock Hits Fresh 52-Week Low On Near-Term Profitability Concerns, But Citi Sees Over 75% Upside
MDGL Stock Hits Fresh 52-Week Low On Near-Term Profitability Concerns, But Citi Sees Over 75% Upside
VB
AXSM Stock Hits Fresh 52-Week Lows As Launch Concerns Of Auvelity In Alzheimer's Care Outweigh Q3 Beat
AXSM Stock Hits Fresh 52-Week Lows As Launch Concerns Of Auvelity In Alzheimer's Care Outweigh Q3 Beat
VB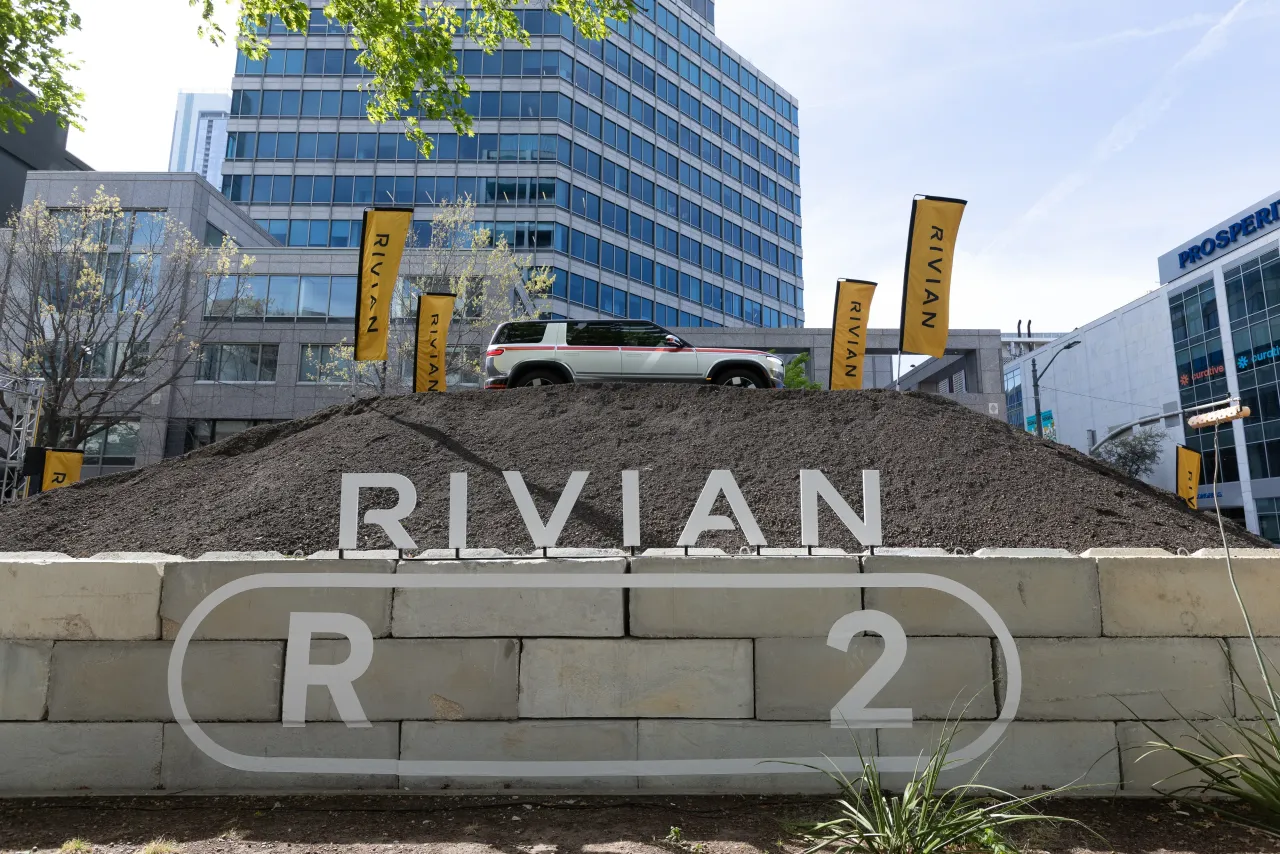
RIVN Jumps 5% After-Hours As Rivian Lifts Full-Year Outlook And Reaffirms Volkswagen Partnership
RIVN Jumps 5% After-Hours As Rivian Lifts Full-Year Outlook And Reaffirms Volkswagen Partnership
VB
Vanguard Small-Cap ETF vs JPMorgan BetaBuilders Compared
Vanguard Small-Cap ETF vs JPMorgan BetaBuilders Compared
VBNews tone: automated (AI) classification of the article's content, not a price prediction.
Technical indicators
- RSI 14
- 56.26
- MACD 12/26/9
- 0.77
- EMA 9 of MACD
- 0.16
- MACD histogram
- 0.61
- SMA 50
- $290.29
- Price above SMA 50
- EMA 50
- $291.34
- Price above EMA 50
- SMA 200
- $286.95
- Price above SMA 200
- EMA 200
- $283.92
- Price above EMA 200
Calculated by Gotrade from daily closing prices, as of November 11, 2026. Technical data, not a recommendation.
Analyst ratings
No analyst data available
Financials
Performance
No data available
Debt & Balance Sheet
No data available
Revenue to Profit
No data available
Earnings
No data available
Source: third-party data provider
Latest news
MDGL Stock Hits Fresh 52-Week Low On Near-Term Profitability Concerns, But Citi Sees Over 75% Upside
MDGL Stock Hits Fresh 52-Week Low On Near-Term Profitability Concerns, But Citi Sees Over 75% Upside
VBAXSM Stock Hits Fresh 52-Week Lows As Launch Concerns Of Auvelity In Alzheimer's Care Outweigh Q3 Beat
AXSM Stock Hits Fresh 52-Week Lows As Launch Concerns Of Auvelity In Alzheimer's Care Outweigh Q3 Beat
VBRIVN Jumps 5% After-Hours As Rivian Lifts Full-Year Outlook And Reaffirms Volkswagen Partnership
RIVN Jumps 5% After-Hours As Rivian Lifts Full-Year Outlook And Reaffirms Volkswagen Partnership
VBVanguard Small-Cap ETF vs JPMorgan BetaBuilders Compared
Vanguard Small-Cap ETF vs JPMorgan BetaBuilders Compared
VB
RIVN Stock Rebounds As Unconfirmed Walmart Delivery Van Sparks Fleet Hopes
RIVN Stock Rebounds As Unconfirmed Walmart Delivery Van Sparks Fleet Hopes
VB
SpaceX's Spectrum Deal Could Boost AST SpaceMobile’s Strategic Value — Analyst Calls ASTS 'Natural Satellite Partner' For Carriers
SpaceX's Spectrum Deal Could Boost AST SpaceMobile’s Strategic Value — Analyst Calls ASTS 'Natural Satellite Partner' For Carriers
VB
3 ETFs for the Companies Large-Cap Funds Leave Out. One Returned 18.03% Over the Past Year
3 ETFs for the Companies Large-Cap Funds Leave Out. One Returned 18.03% Over the Past Year
VB
QXO Hits Fresh 52-Week Lows On Soft Residential Roofing Demand
QXO Hits Fresh 52-Week Lows On Soft Residential Roofing Demand
VBRivian’s New R2 Joins R1S And R1T In EV Maker’s Largest Recall
Rivian’s New R2 Joins R1S And R1T In EV Maker’s Largest Recall
VB
Prediction: This Underrated ETF Could Be the Most Surprising Outperformer of the Next 10 Years
Prediction: This Underrated ETF Could Be the Most Surprising Outperformer of the Next 10 Years
VBNews tone: automated (AI) classification of the article's content, not a price prediction.
About Vanguard Small-cap Index ETF
The Vanguard Small-Cap ETF seeks to track the performance of the CRSP US Small Cap Index, which measures the investment return of small-capitalization stocks. The fund provides a convenient way to match the performance of a diversified group of small companies.
Fundamentals
Trading
Dividend
Source: third-party data provider, as of November 13, 2026
Technical indicators
- RSI 14
- 56.26
- MACD 12/26/9
- 0.77
- EMA 9 of MACD
- 0.16
- MACD histogram
- 0.61
- SMA 50
- $290.29
- Price above SMA 50
- EMA 50
- $291.34
- Price above EMA 50
- SMA 200
- $286.95
- Price above SMA 200
- EMA 200
- $283.92
- Price above EMA 200
Calculated by Gotrade from daily closing prices, as of November 11, 2026. Technical data, not a recommendation.
Analyst views
No analyst data available
Seasonality
Monthly price change (%)| Jan | Feb | Mar | Apr | May | Jun | Jul | Aug | Sep | Oct | Nov | Dec | |
|---|---|---|---|---|---|---|---|---|---|---|---|---|
| 2021 | -7.5 | +5.1 | ||||||||||
| 2022 | -8.5 | -0.4 | +3.1 | -9.0 | -0.9 | -9.1 | +9.1 | -2.5 | -9.1 | +6.9 | +4.0 | -6.4 |
| 2023 | +10.8 | -3.8 | -4.2 | -1.1 | -2.0 | +7.3 | +4.6 | -3.3 | -6.9 | -4.6 | +8.6 | +6.8 |
| 2024 | -2.0 | +4.3 | +3.3 | -5.7 | +4.0 | -1.2 | +7.9 | +2.5 | +4.3 | +0.4 | +10.3 | -7.6 |
| 2025 | +4.0 | -3.7 | -4.4 | -2.8 | +5.2 | +4.0 | +0.9 | +6.3 | +1.2 | +0.0 | +1.7 | +0.4 |
| 2026 | +3.2 | +2.0 | -6.0 | +8.0 | +3.1 | +3.4 | -2.1 | -0.2 | -3.9 | +1.2 | +1.2 |
Corporate actions
Upcoming
No upcoming corporate actions for VB










