
Vanguard Small-cap Value ETF (VBR) Stock
Key stats
- Market cap
- $24.46B
- Volume
- Loading
- 52-week high
- $251.85
- 52-week low
- $198.76
Source: third-party data provider, as of November 13, 2026
Recent news

Prediction: This Brilliant ETF Will Crush the S&P 500 Over the Next 20 Years
Prediction: This Brilliant ETF Will Crush the S&P 500 Over the Next 20 Years
VBR
Small-Cap Value ETF Showdown: Vanguard's VBR vs. the State Street SLYV
Small-Cap Value ETF Showdown: Vanguard's VBR vs. the State Street SLYV
VBR
This ETF Has a Lot Riding on the Fed's Next Move
This ETF Has a Lot Riding on the Fed's Next Move
VBR
Nervous About Big Tech? This Vanguard Value ETF Is Where the Money Is Rotating
Nervous About Big Tech? This Vanguard Value ETF Is Where the Money Is Rotating
VBRNews tone: automated (AI) classification of the article's content, not a price prediction.
Technical indicators
- RSI 14
- 61.67
- MACD 12/26/9
- 2.48
- EMA 9 of MACD
- 1.85
- MACD histogram
- 0.63
- SMA 50
- $239.64
- Price above SMA 50
- EMA 50
- $241.37
- Price above EMA 50
- SMA 200
- $235.45
- Price above SMA 200
- EMA 200
- $233.40
- Price above EMA 200
Calculated by Gotrade from daily closing prices, as of November 11, 2026. Technical data, not a recommendation.
Analyst ratings
No analyst data available
Financials
Performance
No data available
Debt & Balance Sheet
No data available
Revenue to Profit
No data available
Earnings
No data available
Source: third-party data provider
Latest news
Prediction: This Brilliant ETF Will Crush the S&P 500 Over the Next 20 Years
Prediction: This Brilliant ETF Will Crush the S&P 500 Over the Next 20 Years
VBRSmall-Cap Value ETF Showdown: Vanguard's VBR vs. the State Street SLYV
Small-Cap Value ETF Showdown: Vanguard's VBR vs. the State Street SLYV
VBRThis ETF Has a Lot Riding on the Fed's Next Move
This ETF Has a Lot Riding on the Fed's Next Move
VBRNervous About Big Tech? This Vanguard Value ETF Is Where the Money Is Rotating
Nervous About Big Tech? This Vanguard Value ETF Is Where the Money Is Rotating
VBR
Better Value ETF: Vanguard's Small Cap-Focused VBR vs. the iShares IJJ Targeting Mid-Cap Stocks
Better Value ETF: Vanguard's Small Cap-Focused VBR vs. the iShares IJJ Targeting Mid-Cap Stocks
VBR
Vanguard Is "Cautious" on U.S. Growth Stocks. These 2 Value ETFs Could Be Smarter Buys for Long-Term Investors.
Vanguard Is "Cautious" on U.S. Growth Stocks. These 2 Value ETFs Could Be Smarter Buys for Long-Term Investors.
VBR
VBR vs. IWN: Which Small-Cap Value ETF Is the Better Buy?
VBR vs. IWN: Which Small-Cap Value ETF Is the Better Buy?
VBR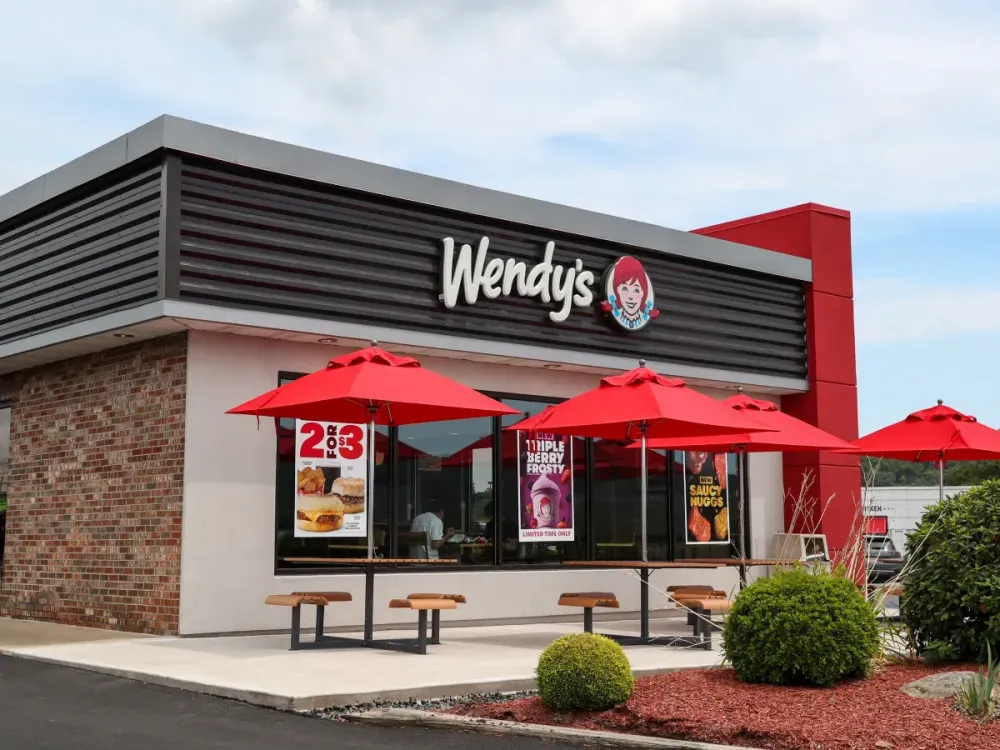
WEN Stock Soars After Nelson Peltz Reportedly Prepares Take-Private Bid For The Burger Chain
WEN Stock Soars After Nelson Peltz Reportedly Prepares Take-Private Bid For The Burger Chain
VBR
Should Vanguard Small-Cap Value Index Fund ETF Shares (VBR) Be on Your Investing Radar?
Should Vanguard Small-Cap Value Index Fund ETF Shares (VBR) Be on Your Investing Radar?
VBR
Vanguard Small-Cap Value ETF Outshines State Street on Fees But is It the Better Buy?
Vanguard Small-Cap Value ETF Outshines State Street on Fees But is It the Better Buy?
VBRNews tone: automated (AI) classification of the article's content, not a price prediction.
About Vanguard Small-cap Value ETF
The Vanguard Small-Cap Value ETF seeks to track the performance of the CRSP US Small Cap Value Index, which measures the investment return of small-capitalization value stocks. The fund provides a convenient way to match the performance of a diversified group of small value companies.
Fundamentals
Trading
Dividend
Source: third-party data provider, as of November 13, 2026
Technical indicators
- RSI 14
- 61.67
- MACD 12/26/9
- 2.48
- EMA 9 of MACD
- 1.85
- MACD histogram
- 0.63
- SMA 50
- $239.64
- Price above SMA 50
- EMA 50
- $241.37
- Price above EMA 50
- SMA 200
- $235.45
- Price above SMA 200
- EMA 200
- $233.40
- Price above EMA 200
Calculated by Gotrade from daily closing prices, as of November 11, 2026. Technical data, not a recommendation.
Analyst views
No analyst data available
Seasonality
Monthly price change (%)| Jan | Feb | Mar | Apr | May | Jun | Jul | Aug | Sep | Oct | Nov | Dec | |
|---|---|---|---|---|---|---|---|---|---|---|---|---|
| 2021 | -7.5 | +6.0 | ||||||||||
| 2022 | -5.2 | +0.5 | +3.5 | -6.9 | +1.5 | -10.2 | +8.3 | -2.7 | -9.7 | +9.0 | +5.2 | -6.1 |
| 2023 | +9.4 | -3.5 | -6.4 | -1.0 | -3.3 | +8.1 | +4.8 | -3.2 | -6.4 | -3.3 | +7.9 | +6.3 |
| 2024 | -2.3 | +3.0 | +4.6 | -5.1 | +4.1 | -2.3 | +9.8 | +2.3 | +3.5 | -0.1 | +8.7 | -8.0 |
| 2025 | +3.9 | -2.4 | -3.8 | -3.6 | +4.8 | +3.5 | -0.2 | +6.9 | +0.6 | -1.4 | +2.7 | +0.4 |
| 2026 | +4.0 | +2.2 | -5.7 | +6.5 | +1.3 | +3.8 | +0.8 | -1.0 | -5.2 | +4.7 | +1.1 |
Corporate actions
Upcoming
No upcoming corporate actions for VBR










