
Vanguard Information Technology ETF (VGT) Stock
Fundamentals
Source: third-party data provider, as of October 9, 2026
Recent news

Nasdaq 100 Ends Lower As Report Of Weaker-Than-Expected OpenAI Revenue Drags Chipmakers — NVDA, DIS, ORCL, SBUX In Focus
Nasdaq 100 Ends Lower As Report Of Weaker-Than-Expected OpenAI Revenue Drags Chipmakers — NVDA, DIS, ORCL, SBUX In Focus
VGT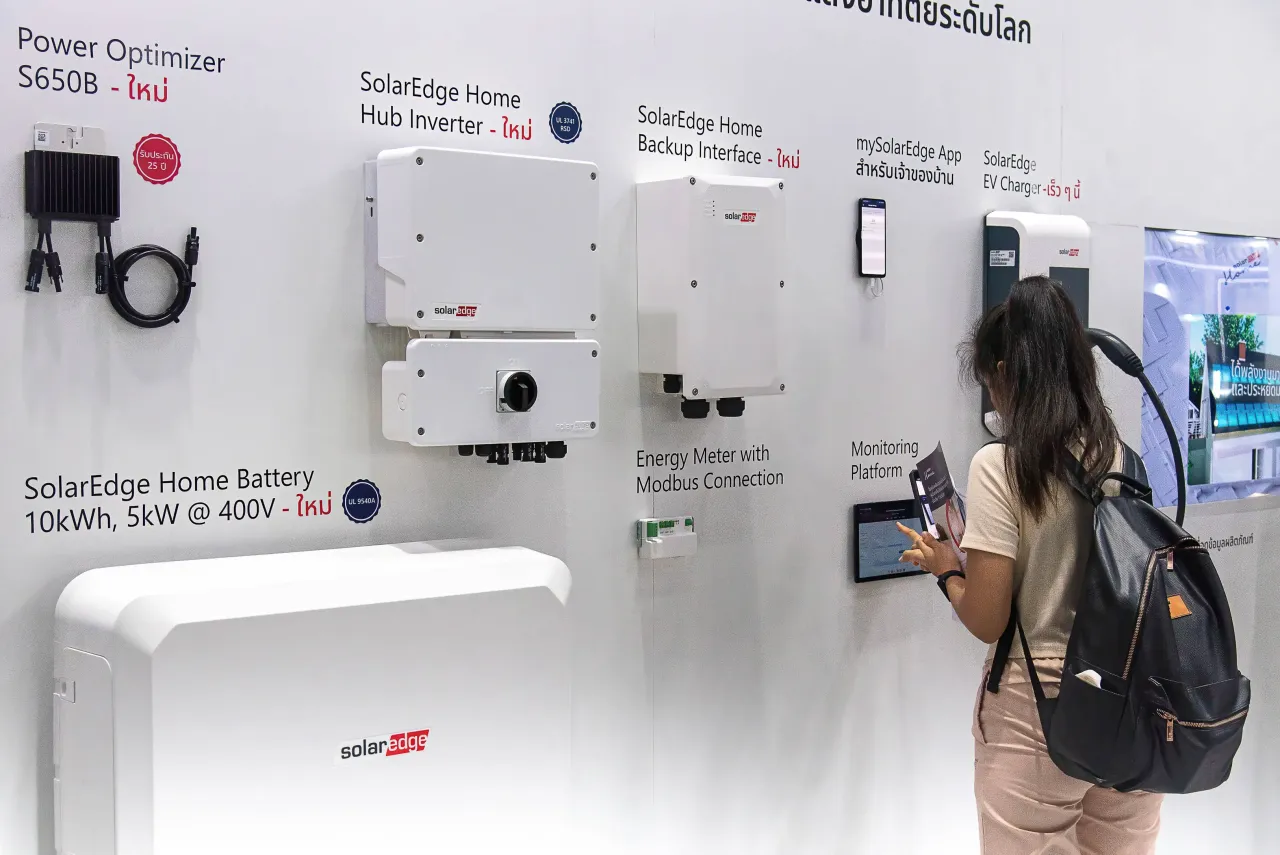
SEDG Stock Slides After Deutsche Bank Tags It A Short-Term Sell
SEDG Stock Slides After Deutsche Bank Tags It A Short-Term Sell
VGT
Forget Index Funds: Here's the One Sector I'd Buy First as a New Investor
Forget Index Funds: Here's the One Sector I'd Buy First as a New Investor
VGT
Here's How Much You'd Need to Invest in VGT to Generate $500 per Month in Dividends
Here's How Much You'd Need to Invest in VGT to Generate $500 per Month in Dividends
VGTNews tone: automated (AI) classification of the article's content, not a price prediction.
Technical indicators
- RSI 14
- 59.53
- MACD 12/26/9
- 2.26
- EMA 9 of MACD
- 2.03
- MACD histogram
- 0.22
- SMA 50
- $121.63
- Price above SMA 50
- EMA 50
- $122.08
- Price above EMA 50
- SMA 200
- $107.24
- Price above SMA 200
- EMA 200
- $109.05
- Price above EMA 200
Calculated by Gotrade from daily closing prices, as of October 8, 2026. Technical data, not a recommendation.
Analyst ratings
No analyst data available
Financials
Performance
No data available
Debt & Balance Sheet
No data available
Revenue to Profit
No data available
Earnings
No data available
Source: third-party data provider
Latest news
Nasdaq 100 Ends Lower As Report Of Weaker-Than-Expected OpenAI Revenue Drags Chipmakers — NVDA, DIS, ORCL, SBUX In Focus
Nasdaq 100 Ends Lower As Report Of Weaker-Than-Expected OpenAI Revenue Drags Chipmakers — NVDA, DIS, ORCL, SBUX In Focus
VGTSEDG Stock Slides After Deutsche Bank Tags It A Short-Term Sell
SEDG Stock Slides After Deutsche Bank Tags It A Short-Term Sell
VGTForget Index Funds: Here's the One Sector I'd Buy First as a New Investor
Forget Index Funds: Here's the One Sector I'd Buy First as a New Investor
VGTHere's How Much You'd Need to Invest in VGT to Generate $500 per Month in Dividends
Here's How Much You'd Need to Invest in VGT to Generate $500 per Month in Dividends
VGT
If You Invest $300 Per Month in the Vanguard Information Technology ETF for 20 Years, Here's What History Says You Could End Up With
If You Invest $300 Per Month in the Vanguard Information Technology ETF for 20 Years, Here's What History Says You Could End Up With
VGT
Broadcom Reportedly Lines Up $60B AI Chip Financing As Anthropic Expands Compute
Broadcom Reportedly Lines Up $60B AI Chip Financing As Anthropic Expands Compute
VGT
Had You Bought This Vanguard ETF at the Start of January, You'd be Obliterating the S&P 500 in 2026
Had You Bought This Vanguard ETF at the Start of January, You'd be Obliterating the S&P 500 in 2026
VGT
Apple Takes Aim at the Smart Home: ETFs to Tap?
Apple Takes Aim at the Smart Home: ETFs to Tap?
VGT
Vanguard Tech ETF (VGT) vs. iShares Tech ETF (IYW): Which Offers Better Value for Investors?
Vanguard Tech ETF (VGT) vs. iShares Tech ETF (IYW): Which Offers Better Value for Investors?
VGT
S&P 500, Dow Extend Losses From Elevated Yield Pressure — SPCX, TGT, AAPL, MU, NTAP In Focus
S&P 500, Dow Extend Losses From Elevated Yield Pressure — SPCX, TGT, AAPL, MU, NTAP In Focus
VGTNews tone: automated (AI) classification of the article's content, not a price prediction.
About Vanguard Information Technology ETF
The Vanguard Information Technology ETF seeks to track the performance of a benchmark index that measures the investment return of stocks in the information technology sector. Passively managed, using a full-replication strategy when possible and a sampling strategy if regulatory constraints dictate. The fund includes stocks of companies that serve the electronics and computer industries or that manufacture products based on the latest applied science.
Fundamentals
Valuation
Income Statement
Dividend
Source: third-party data provider, as of October 9, 2026
Technical indicators
- RSI 14
- 59.53
- MACD 12/26/9
- 2.26
- EMA 9 of MACD
- 2.03
- MACD histogram
- 0.22
- SMA 50
- $121.63
- Price above SMA 50
- EMA 50
- $122.08
- Price above EMA 50
- SMA 200
- $107.24
- Price above SMA 200
- EMA 200
- $109.05
- Price above EMA 200
Calculated by Gotrade from daily closing prices, as of October 8, 2026. Technical data, not a recommendation.
Analyst views
No analyst data available
Seasonality
Monthly price change (%)| Jan | Feb | Mar | Apr | May | Jun | Jul | Aug | Sep | Oct | Nov | Dec | |
|---|---|---|---|---|---|---|---|---|---|---|---|---|
| 2021 | +7.0 | +3.0 | +4.2 | |||||||||
| 2022 | -8.6 | -4.7 | +5.1 | -11.6 | -3.3 | -9.2 | +13.0 | -5.5 | -11.2 | +4.3 | +6.2 | -8.5 |
| 2023 | +10.8 | -1.9 | +10.3 | -0.1 | +8.3 | +5.0 | +3.0 | -2.2 | -7.1 | -2.6 | +11.5 | +4.2 |
| 2024 | +4.8 | +3.5 | -0.6 | -5.8 | +9.3 | +7.3 | -2.4 | +4.8 | +6.9 | +1.8 | +6.1 | -1.0 |
| 2025 | -0.8 | -1.5 | -6.2 | +0.5 | +8.5 | +8.4 | +5.2 | +3.4 | +8.2 | +5.4 | -5.5 | +0.2 |
| 2026 | -1.1 | -3.5 | -4.9 | +16.8 | +15.5 | -3.8 | -3.5 | +4.6 | +5.7 | +0.2 |
Corporate actions
Upcoming
No upcoming corporate actions for VGT










